2024-07-12
한어Русский языкEnglishFrançaisIndonesianSanskrit日本語DeutschPortuguêsΕλληνικάespañolItalianoSuomalainenLatina
Grafana is a tool for viewing and analyzing data, and is particularly good at monitoring and visualizing time series data.
Visualization Tools: Grafana can turn data into charts, making it easier for you to understand and analyze data.
Open Source Software: Anyone can use and modify it for free.
Connect different data sources: It can obtain data from a variety of data sources, such as Prometheus, Elasticsearch, MySQL, etc.
Create a dashboard: You can create dashboards containing various charts to monitor and present data.
To set an alarm: When the data meets a certain condition, Grafana can send a notification to remind you.
teamwork: Different users can use and manage Grafana together, and each has different access permissions.
Server Monitoring: View server performance, such as CPU usage, memory usage, etc.
Application Monitoring: Monitor application health and performance.
Business data analysis: Analyze business indicators such as sales data, user activity, etc.
IoT Data Visualization: View data from sensors in real time.
Although Prometheus has built-in basic graphical display functions, Grafana provides a more powerful, flexible and user-friendly visualization and monitoring solution. For scenarios that require complex charts, integration of multiple data sources, detailed alerts and team collaboration, Grafana is a more suitable choice.
virtual machine
| Ip | CPU name | cpu | Memory | harddisk |
|---|---|---|---|---|
| 192.168.10.14 | prometheus-server | 2c | 2G | 100G |
| 192.168.10.15 | prometheus-agent | 2c | 2G | 100G |
| 192.168.10.16 | grafana | 2c | 2G | 100G |
Version centos7.9
Initialization completed (firewall, sandbox, hostname)
prometheus is installed
Please refer to the previous article for prometheus installation. I will not repeat it here.
Link:Prometheus Review (1) – Installing Prometheus monitoring in binary mode on Linux
This article will use binary installation, and containerized installation will be shown in subsequent articles
Get the binary package
wget https://dl.grafana.com/oss/release/grafana-10.0.1.linux-amd64.tar.gz
Unpack and view
tar xf grafana-10.0.1.linux-amd64.tar.gz
ls

Move to /usr/local/ for easy management
mv grafana-10.0.1 /usr/local/grafana
cd /usr/local/grafana/
ls
There are the following files

For easy management, register it as a system service
cat > /usr/lib/systemd/system/grafana.service << EOF
[Service]
ExecStart=/usr/local/grafana/bin/grafana-server --config=/usr/local/grafana/conf/defaults.ini --homepath=/usr/local/grafana

[Install]
WantedBy=multi-user.target

[Unit]
Description=grafana
After=network.target
EOF
Reload/Auto-start/Check status/Start
systemctl daemon-reload
systemctl enable grafana
 systemctl start grafana
 systemctl status grafana

Grafana Access
Host browser access
Local ip:3000
here it is
192.168.10.16:3000
You will see the following interface

enter
Default account: admin
Default password: admin
Just log in

You will be asked to reset your password later. If you don't want to reset it, just click skip.

Next you will enter the main interface

Click the three dashes in the upper left corner
Then click Data sources in the interface that appears.

Then click Add data source in the interface that appears.

Click prometheus again and select prometheus as the data source

Enter after the Prometheus server URL
Prometheus access address, that is
http://192.168.10.14:9090
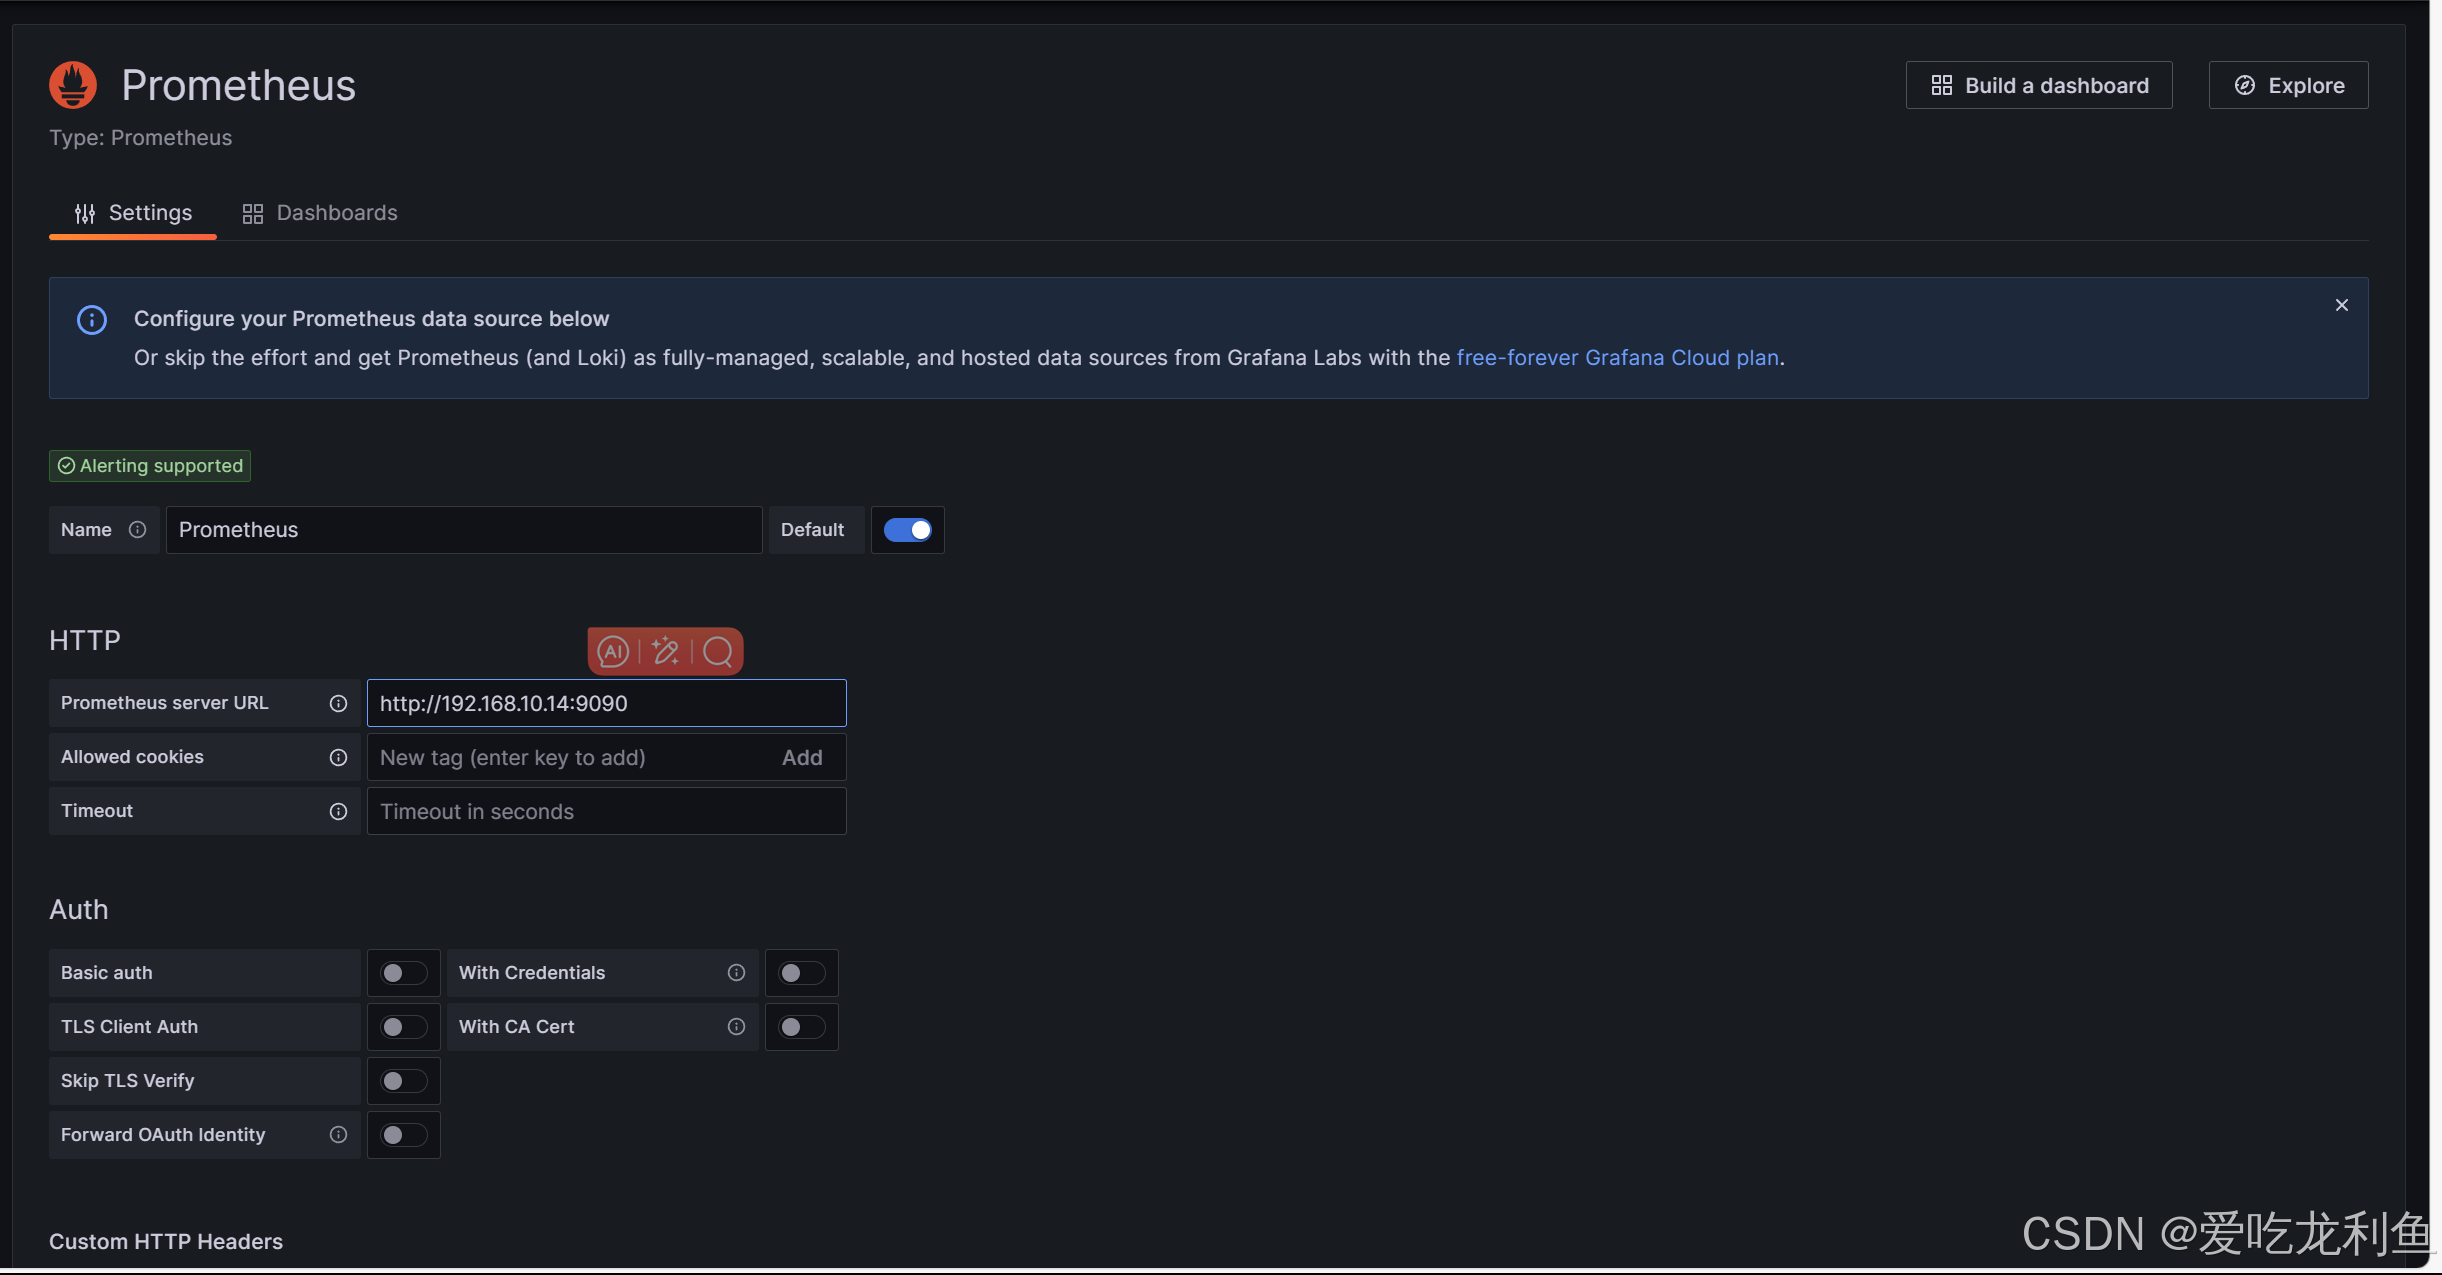
Then scroll to the end and click save&test

A check mark is displayed indicating that the prometheus data source is successful

Then click Dashboards

Click new, then select import

You can see that there are two ways to add a dashboard
One is json format
One is ID
Here we use ID
This is a dashboard about liunx host
12633
At the end there will be a tutorial on how to find the right dashboard according to your needs


Click Import

This is the monitoring interface.


Browser Search
grafana.com
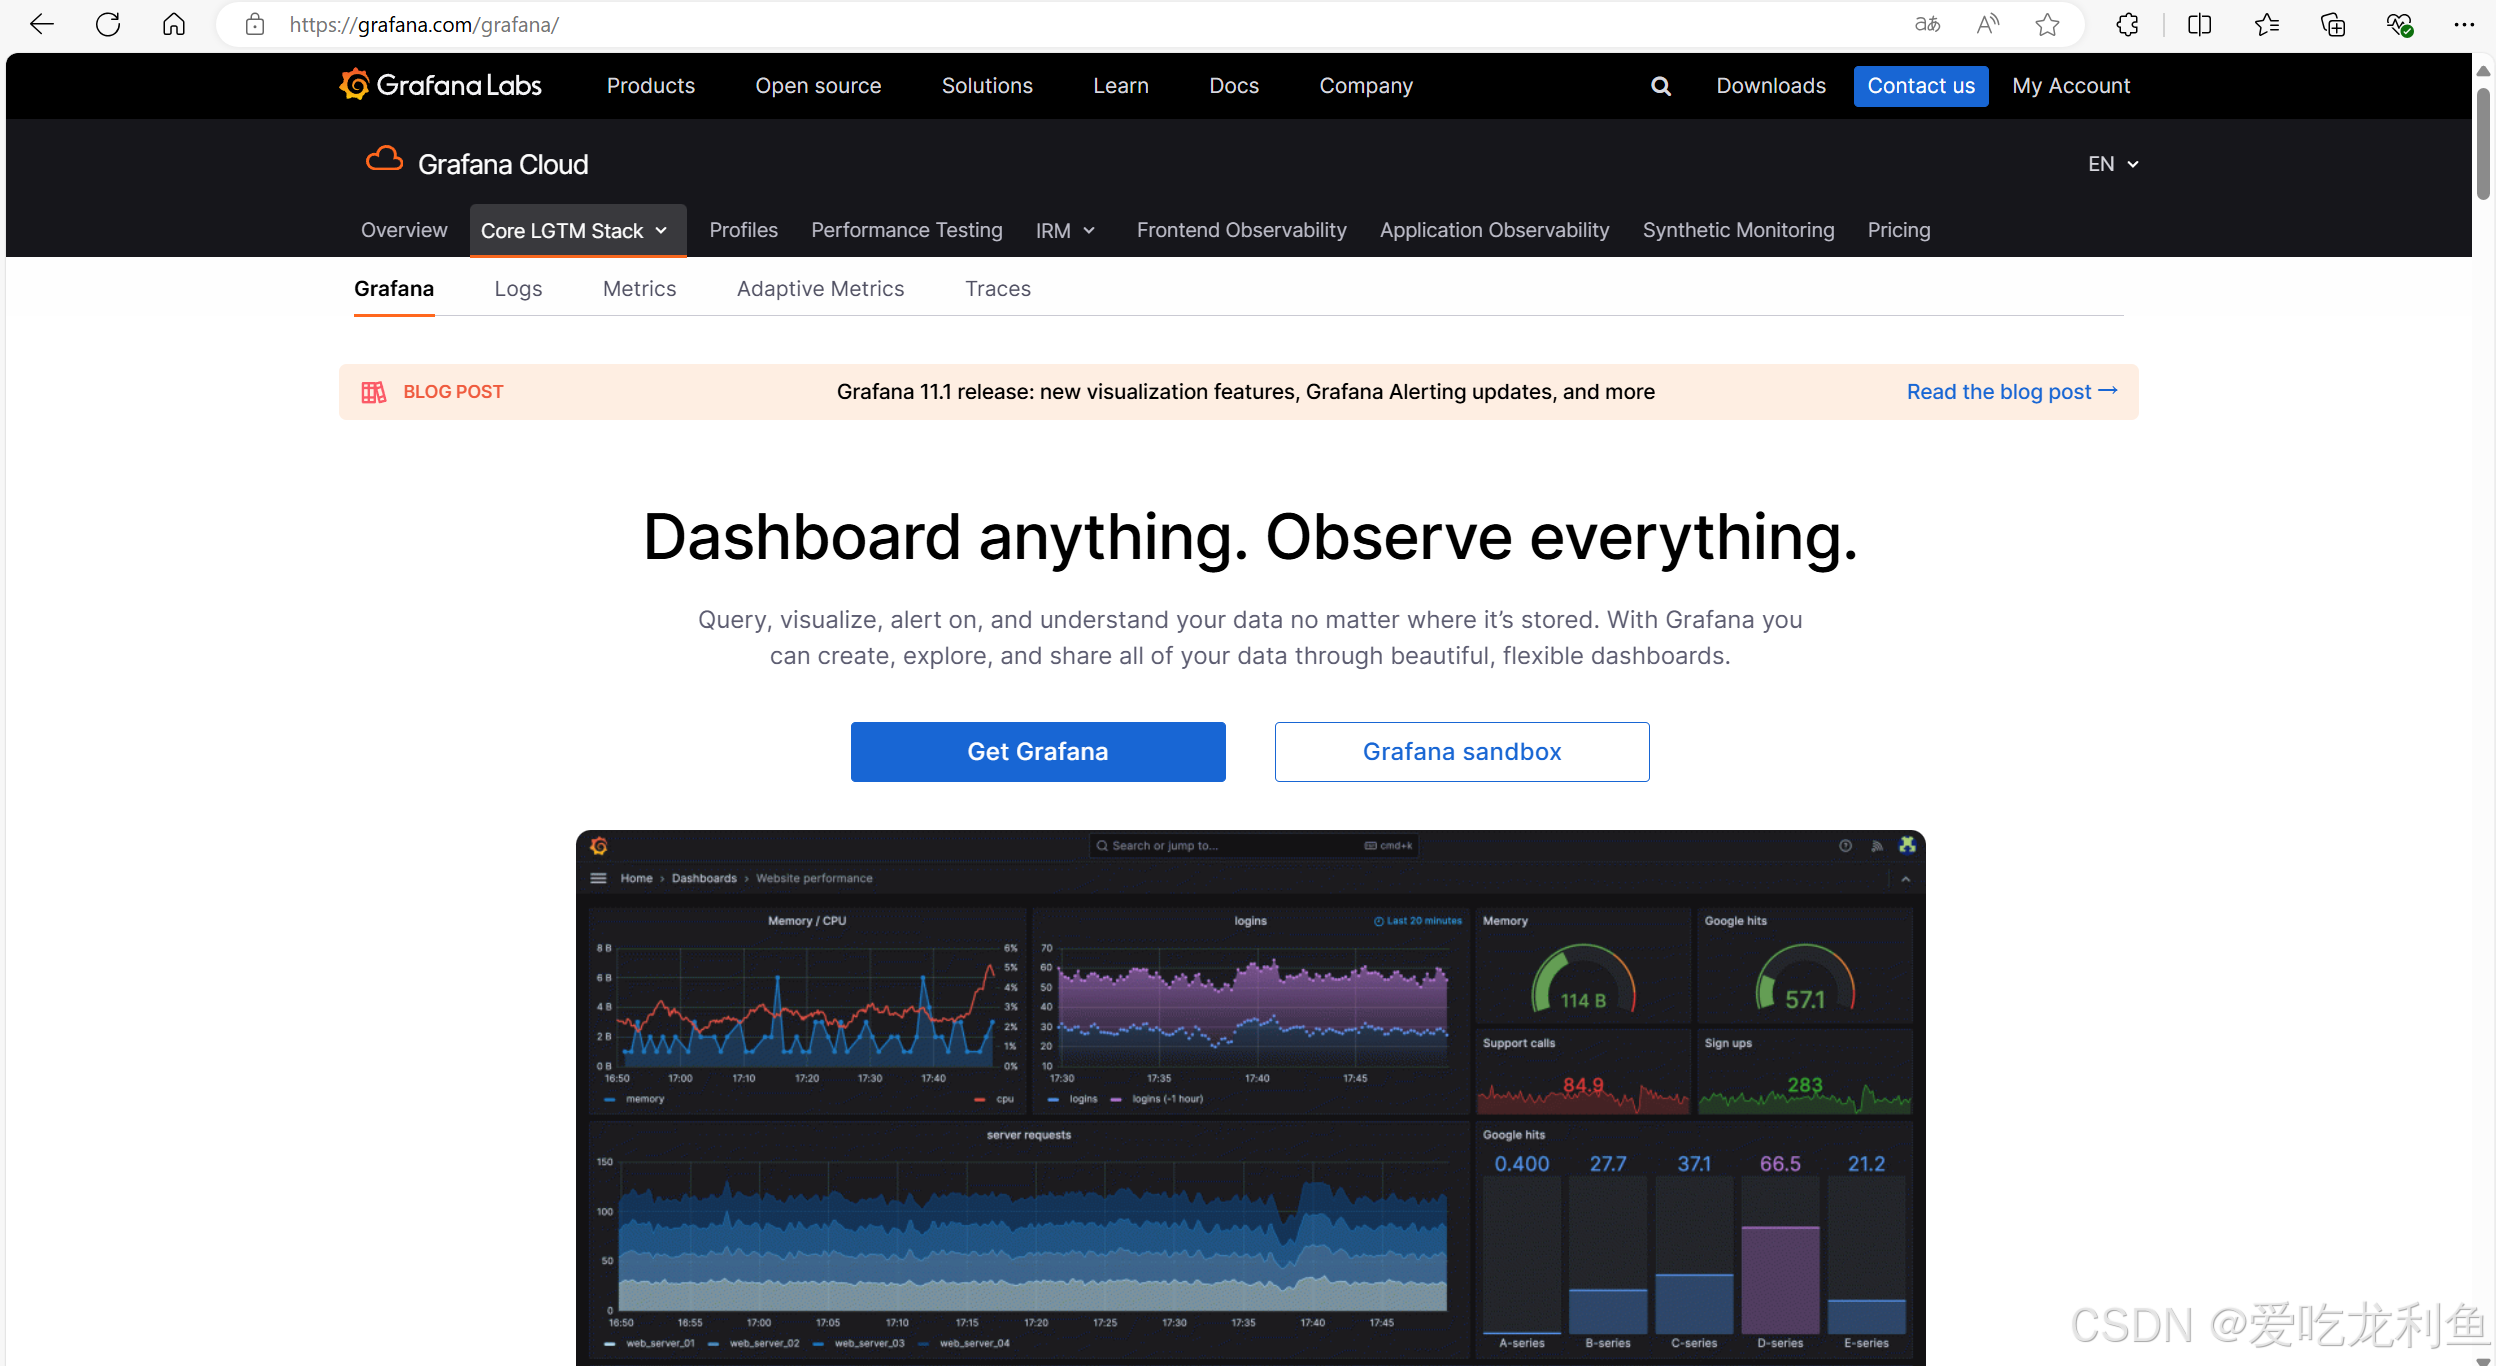
You need to register an account here first
Visit after registration
https://grafana.com/grafana/dashboards/
You can
Then you can search the dashboard as needed

For example, the dashboard just now
Search for liunx host
You can see that the first one is the dashboard template we use
click it

There are two usage methods provided in this interface
Download the json file or copy the ID
You can also see what its id is


I have devoted myself to the research of technology for more than 30 years. I am proficient in various languages such as Java, Linux, JavaScript, PHP, CSS, etc. I have made many contributions in the field of open source. I have established a developer documentation site to share some problems in technology development for everyone to read.
