2024-07-12
한어Русский языкEnglishFrançaisIndonesianSanskrit日本語DeutschPortuguêsΕλληνικάespañolItalianoSuomalainenLatina
- 初始化操作
- systemctl disable --now firewalld
- setenforce 0
- vim /etc/selinux/config
- SELINUX=disabled
- cd /opt
- grafana-enterprise-9.4.7-1.x86_64.rpm #上传软件包
- yum localinstall -y grafana-enterprise-9.4.7-1.x86_64.rpm #安装
- systemctl enable --now grafana-server.service #开启服务
- netstat -lntp | grep 3000 #查询是否已经开启服务

- 浏览器输入http://192.168.10.104:3000
-
- 账号/密码:admin / admin

Download Zabbix


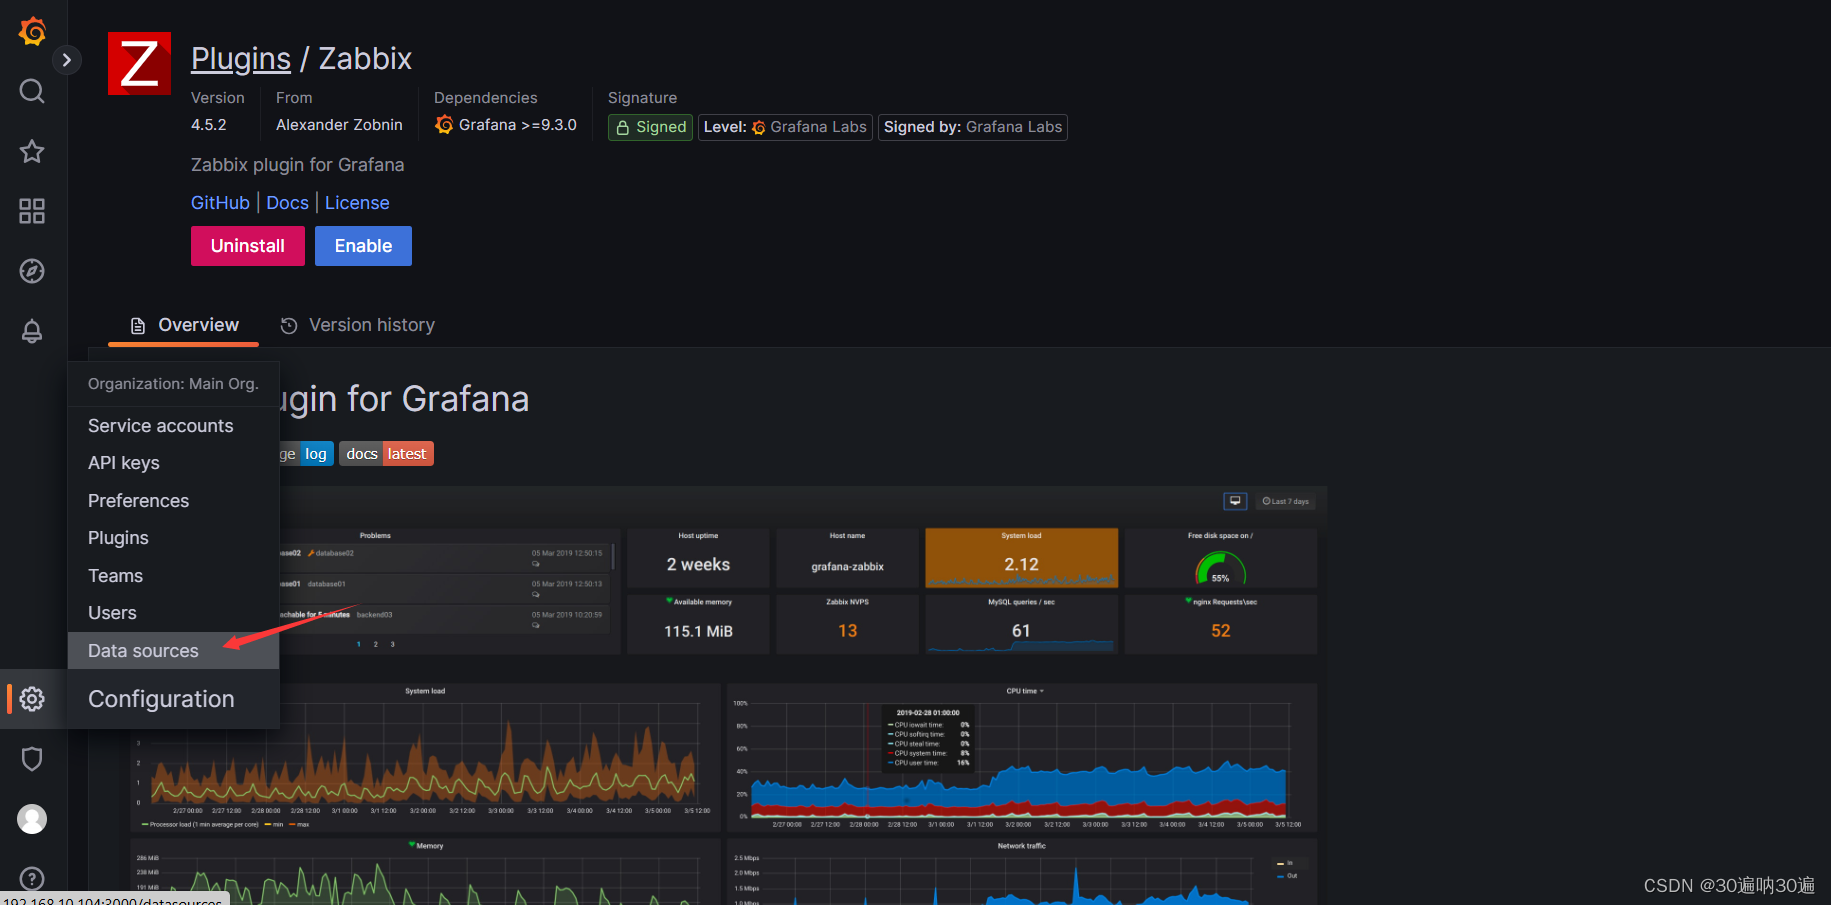


ttps://grafana.com/dashboards You can log in to the website to


I have devoted myself to the research of technology for more than 30 years. I am proficient in various languages such as Java, Linux, JavaScript, PHP, CSS, etc. I have made many contributions in the field of open source. I have established a developer documentation site to share some problems in technology development for everyone to read.
