2024-07-12
한어Русский языкEnglishFrançaisIndonesianSanskrit日本語DeutschPortuguêsΕλληνικάespañolItalianoSuomalainenLatina
Today we share with you a global climate model dataset >100 km released by the IPCC Coupled Model Intercomparison Project Phase 6 (CMIP6) and a global high-resolution climate dataset released by WorldClim, obtained through spatial downscaling methods.A 1km resolution multi-scenario and multi-model monthly precipitation dataset for China from 2021 to 2100.
The data comes from several papers published by Peng Shouzhang (2019) and other scholars in the journal Earth System Science Data, including "1km monthly temperature and precipitation dataset for China from 1901 to 2017". For specific data source papers, please see the original data download website.
Among them, "multiple scenarios" refers to the latest SSP-RCP scenarios released by the Intergovernmental Panel on Climate Change (IPCC): SSP119, SSP245, SSP585, and "multiple models" refers to the three GCMs models among the more than 20 currently released Sixth International Coupled Model Intercomparison Project (CMIP6) models: EC-Earth3, GFDL-ESM4, MRI-ESM2-0. Let's introduce them in detail below:
CMIP is an international cooperation project initiated by the Working Group on Coupled Models (WGCM) initiated and organized by the World Climate Research Program (WCRP) in 1995. Its purpose is to understand past, present and future climate change by collecting and comparing the simulation results of various global climate models (GCMs). So far, WGCM has organized 6 model comparison programs (CMIP1-6). Based on the climate change simulation and projection data of the CMIP program, the international scientific community has published a large number of academic papers, which directly supported the writing of the assessment report of the Intergovernmental Panel on Climate Change (IPCC). CMIP6 is the one with the largest number of participating models, the most complete scientific experiments, and the largest amount of simulation data in the more than 20 years since the implementation of the CMIP program. The output results of all its climate models will be shared with scientists from various countries and applied to climate change science, impacts, and countermeasures.
The Scenario Model Intercomparison Project (ScenarioMIP) of CMIP6 provides a set of scenarios combining shared socioeconomic pathways (SSPs) with representative concentration pathways (RCPs). Among them, SSP describes the possible development of future society, and SSP1, SSP2, SSP3, SSP4 and SSP5 represent five pathways: sustainable development, intermediate development, regional competitive development, unbalanced development and conventional development. RCP is used to describe scenarios of future greenhouse gas concentrations and radiative forcing, such as RCP2.6, RCP4.5, RCP6 and RCP8.5. These numbers represent different levels of radiative forcing (expressed in W/m²).
The three SSP-RCP scenarios in the data shared this time are: (1) SSP1-1.9: a combination of SSP1 and RCP1.9, the current lowest radiative emission scenario, with radiative forcing reaching about 1.9 W/m² in 2100; (2) SSP2-4.5: a combination of SSP2 and RCP4.5, a medium radiative forcing scenario, with radiative forcing stabilizing at about 4.5 W/m² in 2100; (3) SSP5-8.5: a combination of SSP5 and RCP8.5, a high forcing scenario, with emissions reaching as high as 8.5 W/m² by 2100.
The three global climate models (GCMs) are: (1) EC-Earth3: developed by the European Centre for Medium-Range Weather Forecasts (ECMWF) and a series of European research institutions, with a horizontal resolution of 512×256; (2) GFDL-ESM4: developed by the Geophysical Fluid Dynamics Laboratory (GFDL) of the National Oceanic and Atmospheric Administration (NOAA) of the United States, with a horizontal resolution of 288×180; (3) MRI-ESM2-0: a second-generation climate model developed by the Meteorological Research Institute (MRI) of Japan, with a horizontal resolution of 320×160.
You can reply to the keywords in the public account 267 Get this data for free!No need to forward the article, get it directly!The following is a detailed introduction to the data:
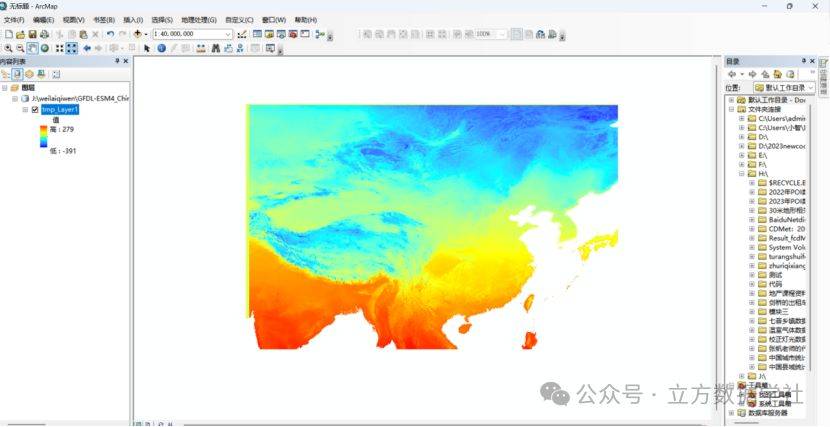
01 Data Preview
Let's take the precipitation data for January 2021 under the EC-Earth3 model in the SSP119 scenario as an example to preview:

02 Data Details
Data Sources:
The data comes from the data shared by Peng Shouzhang on the National Tibetan Plateau Science Data Center platform, the website is:
https://data.tpdc.ac.cn/zh-hans/data/a9cd4a09-51a9-433b-9540-0376c6134cf6
Data introduction:
This dataset is generated by downscaling in China using the Delta spatial downscaling method based on the global >100 km climate model dataset released by the IPCC Coupled Model Intercomparison Project Phase 6 (CMIP6) (https://www.wcrp-climate.org/wgcm-cmip/wgcm-cmip6) and the high-resolution climate dataset released by WorldClim (http://www.worldclim.org/).
the data shows:
(1) The three SSP-RCP climate scenarios (SSP119, SSP245, and SSP585) in this data each contain three GCMs climate models (EC-Earth3, GFDL-ESM4, and MRI-ESM2-0), so there are a total of 9 data sets. Each set of data stores the 80 years from 2021 to 2100 as an nc file every 2 years (each file has 24 bands, and each band contains the precipitation data for that month), that is, 40 nc files, with time serial numbers 1-40, serial number 1 represents 2021.1-2022.12, and so on, so there are a total of 9x40=360 nc files.
(2) The file naming format is "GCM_SSP_pre-30s-time sequence number.nc", where GCM represents the climate model name, SSP represents the climate scenario name, and 30s represents 30 seconds (i.e. 0.0083333°). Taking the "EC-Earth3_ssp119_pre-30s-1.nc" file as an example, it represents the 1 km resolution monthly precipitation data from 2021.1 to 2022.12 of the EC-Earth3 climate model downscaled under the SSP1-1.9 scenario.
Data Format:
nc format
Data space range:
Main land areas of China (excluding islands and reefs in the South China Sea)
Spatial resolution:
0.0083333° (about 1 km)
Data Year:
2021-2100 (monthly)
Data Unit:
0.1mm
Data Format:
nc format
Data Citation:
PENG Shouzhang. 1 km multi-scenario and multi-model monthly precipitation data for China in 2021-2100. National Tibetan Plateau / Third Pole Environment Data Center, 10.11866/db.loess.2021.002.
Article citation:
1.Peng, S.Z., Ding, Y.X., Liu, W.Z., & Li, Z. (2019). 1 km monthly temperature and precipitation dataset for China from 1901 to 2017. Earth System Science Data, 11, 1931–1946. https://doi.org/10.5194/essd-11-1931-2019
2.Peng, S.Z., Ding, Y.X., Wen, Z.M., Chen, Y.M., Cao, Y., & Ren, J.Y. (2017). Spatiotemporal change and trend analysis of potential evapotranspiration over the Loess Plateau of China during 2011-2100. Agricultural and Forest Meteorology, 233, 183-194.
https://doi.org/10.1016/j.agrformet.2016.11.129
3.Ding, Y.X., & Peng, S.Z. (2020). Spatiotemporal trends and attribution of drought across China from 1901–2100. Sustainability, 12(2), 477.
4.Ding, Y.X., Peng, S.Z. (2021). Spatiotemporal change and attribution of potential evapotranspiration over China from 1901 to 2100. Theoretical and Applied Climatology. https://doi.org/10.1007/s00704-021-03625-w
If you need to use the data, please download and quote it according to the requirements of the official platform. For more data details, please check the official website!
03 Format Conversion
The data provided by the original website is in nc format. Many students do not know how to process data in this format. To facilitate your use, the following is a tutorial on how to use ArcGIS software to open nc format files and convert them into raster (.tif) format:
1. Search for the "Create NetCDF Raster Layer" tool in ArcGIS software and open it.

2. Load the nc file, which is the position 1 in the figure below. It is important to note that the path here must be in English and there cannot be Chinese in the path! If it is an English path, the dialog box in 2 in the figure below will be filled in by default. No other adjustments are required. Just click OK below!

3. Through the above operations, we can open the nc file in ArcGIS, as shown below:
4. Right-click on the layer name and click "Properties". After opening the layer properties, find NetCDF, and then select the layer you want to visualize by clicking in the dimension value. Finally, right-click the file and export it as a tif format file!


04 Data Acquisition


I have devoted myself to the research of technology for more than 30 years. I am proficient in various languages such as Java, Linux, JavaScript, PHP, CSS, etc. I have made many contributions in the field of open source. I have established a developer documentation site to share some problems in technology development for everyone to read.
