2024-07-12
한어Русский языкEnglishFrançaisIndonesianSanskrit日本語DeutschPortuguêsΕλληνικάespañolItalianoSuomalainenLatina
Due to the large noise interference of the vibration waveform of rotating machinery, the accuracy of the fault diagnosis method that directly extracts and selects the vibration data features is easily affected by noise. At present, the image-based rotating machinery fault diagnosis technology has been rapidly developed. For the fault diagnosis problem of rotating machinery, the traditional method tends to extract the vibration spectrum from the vibration data. The image features extracted by this method are intuitive and obvious, which can ensure the real-time and accuracy of fault diagnosis to a certain extent.
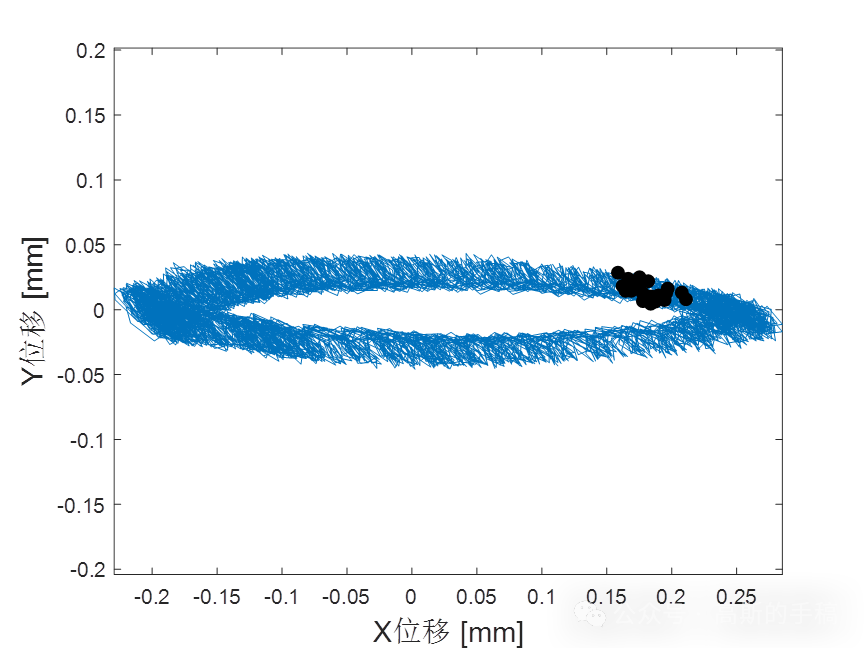
Although the vibration spectrum can intuitively represent the operating status of the unit, the extraction of the spectrum still requires a lot of signal processing. The axis trajectory is an important representation of the vibration signal of the rotating shaft of the rotating machinery. Its shape characteristics are closely related to the operating status of the unit. At present, many scholars have extracted and classified it, and accurately realized the diagnosis of mechanical faults. The axis trajectory diagram is mainly synthesized by the waveform data collected by two perpendicular sensors in the rotor radial direction. The trajectory acquisition method is relatively simple. Therefore, many studies have recently realized the fault diagnosis of rotating machinery based on the axis trajectory.
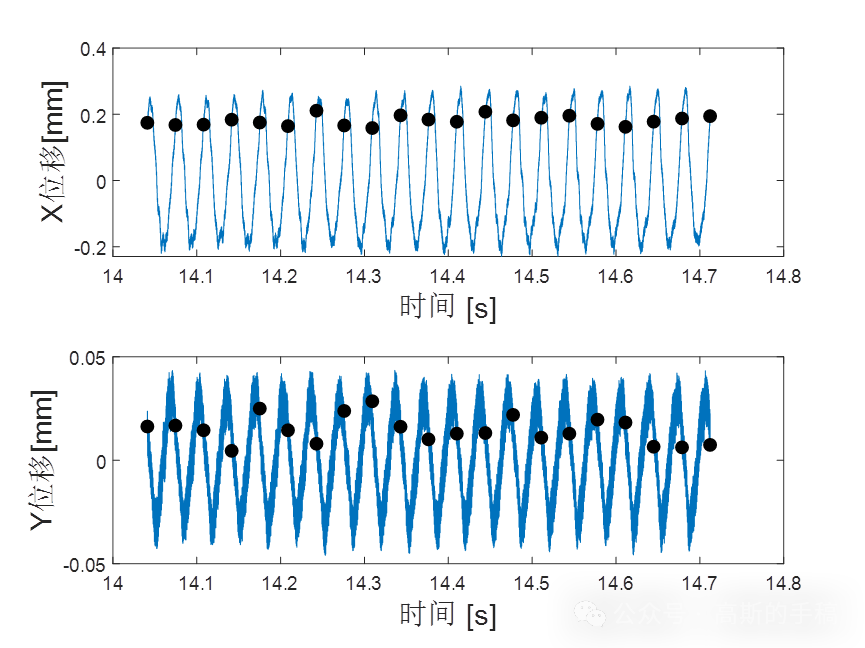
The axis trajectory shows the path of the axis centerline, combining the one-dimensional time domain information from two orthogonal, coplanar sensors into a two-dimensional diagram of the lateral motion of the rotor shaft. Whether the axis trajectory needs to be filtered depends on the specific situation. The axis trajectory/time domain diagram is obtained by merging a trajectory with two XY time domain diagrams used to create the trajectory/time domain diagram. The time domain diagram is displayed to the right of the trajectory diagram, with the Y diagram located above the X diagram. The trajectory/time domain diagram can be used to establish the time relationship of the characteristics on the axis trajectory. In view of this, MATLAB is used to draw the axis trajectory of rotating machinery.
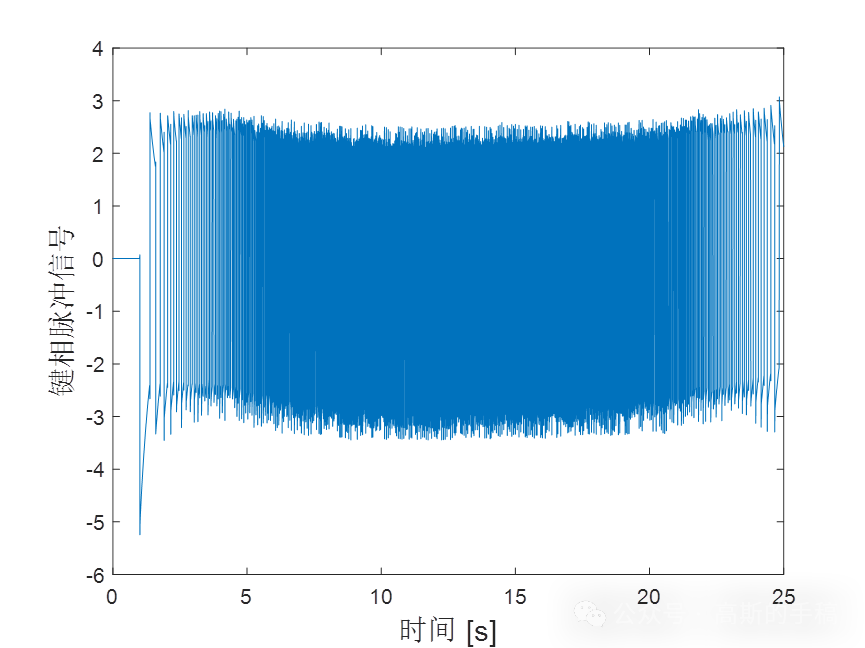
- y = sign(tacho-triglevel);
- dy = diff(y);
- tt = maketime(dy,fs);
- if slope>0;yt = tt(find(dy>1.5));end
- if slope<0;yt = tt(find(dy<1.5));end
- dy = diff(yt);
- dy(length(dy)+1) = dy(length(dy));
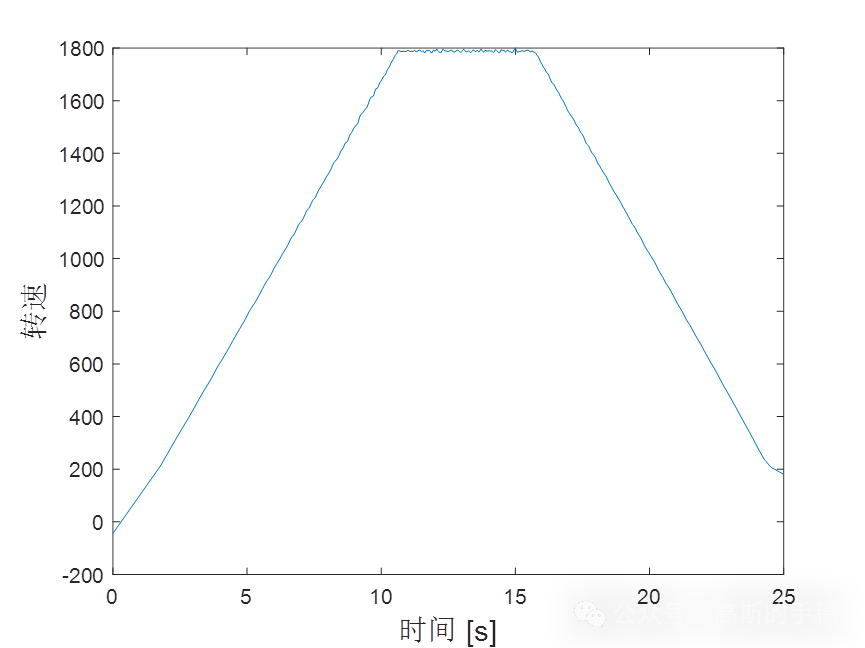
- rpm = 60/ppr*ones(size(dy))./dy;
- b = [.25 .5 .25];
- a = 1;
- rpm = filtfilt(b,a,rpm);
- idx=find(~isnan(rpm));
- rpm=rpm(idx);
- yt=yt(idx);
- N = max(tt)*newfs+2;
- trpm = linspace(0,max(tt),N);
- trpm = trpm(:);
- %pause
- rpm = interp1(yt,rpm,trpm,'linear','extrap'); %interp1(yt,rpm,trpm);
- rpm = rpm(:);
- 完整数据和代码通过知乎学术咨询获得:
- https://www.zhihu.com/consult/people/792359672131756032?isMe=1
Areas of expertise: modern signal processing, machine learning, deep learning, digital twins, time series analysis, equipment defect detection, equipment anomaly detection, equipment intelligent fault diagnosis and health management PHM, etc.

I have devoted myself to the research of technology for more than 30 years. I am proficient in various languages such as Java, Linux, JavaScript, PHP, CSS, etc. I have made many contributions in the field of open source. I have established a developer documentation site to share some problems in technology development for everyone to read.

