2024-07-12
한어Русский языкEnglishFrançaisIndonesianSanskrit日本語DeutschPortuguêsΕλληνικάespañolItalianoSuomalainenLatina
As we all know, MySQL master-slave database (two nodes) generally achieves high data availability through asynchronous replication and semi-synchronous replication (Semi-Sync). However, in abnormal scenarios such as network failure in the computer room and host hang, the master-slave architecture is likely to have data inconsistency problems after HA switching (RPO!=0 for short).Therefore, as long as the business data is of a certain importance, you should not choose a database product with a MySQL master-slave architecture (two nodes). It is recommended to choose a multi-copy architecture with RPO=0.
MySQL community, regarding the evolution of multi-copy technology with RPO=0:
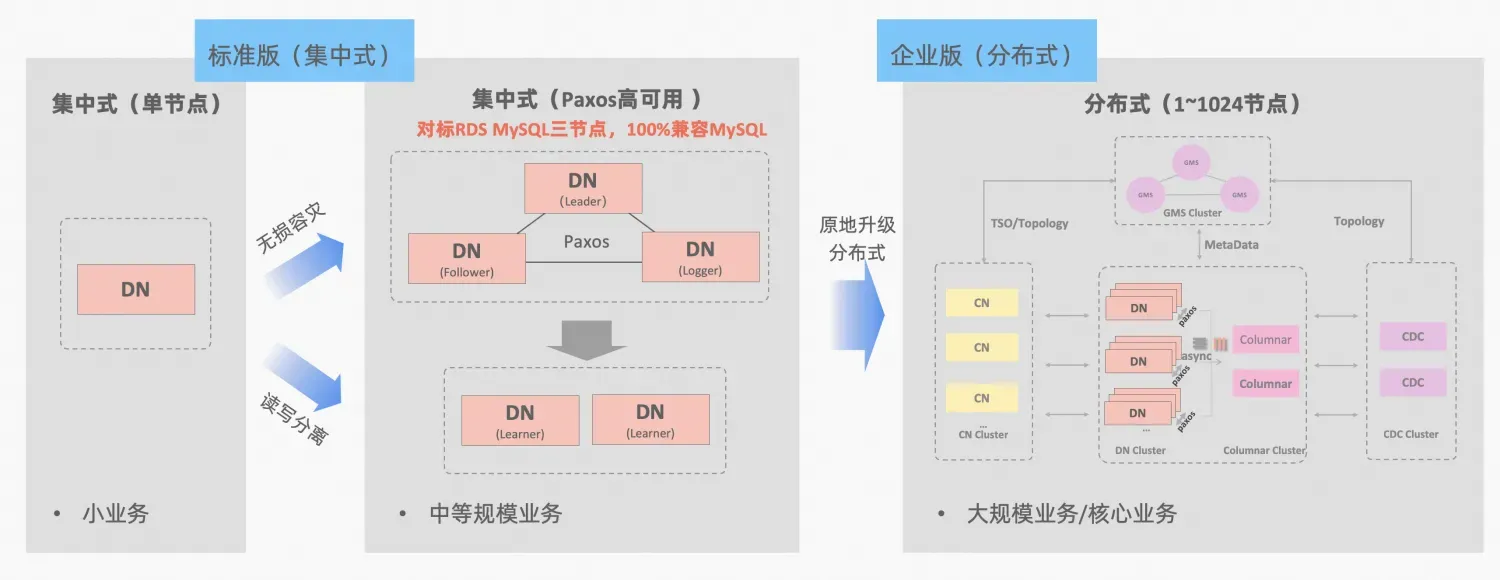
PolarDB-XThe concept of centralized and distributed integration: Data node DN can be separated as a centralized (standard version) form, which is fully compatible with the stand-alone database form. When the business grows to the point where distributed expansion is required, the architecture is upgraded to a distributed form in situ, and the distributed components are seamlessly connected to the original data nodes. No data migration or modification on the application side is required, and the availability and scalability brought by distribution can be enjoyed. Architecture description:Centralized and Distributed Integration
MySQL's MGR and PolarDB-X's standard version DN both use the Paxos protocol at the most basic level. So what are their specific performances and differences in actual use? This article will elaborate on them in detail from the aspects of architecture comparison, key differences, and test comparison.
MGR/DN abbreviation explanation: MGR represents the technical form of MySQL MGR, and DN represents the technical form of PolarDB-X single DN centralized (standard version).
The detailed comparative analysis is quite long, so you can take a look at the summary and conclusion first. If you are interested, you can follow the summary to find clues in subsequent articles.
MySQL MGR is not recommended for general businesses and companies because it requires professional technical knowledge and an operation and maintenance team to use it well. This article also reproduces three long-standing "pitfalls" of MySQL MGR in the industry:
Compared with MySQL MGR, PolarDB-X Paxos does not have the same pitfalls as MGR in terms of data consistency, cross-data center disaster recovery, and node operation and maintenance, but it also has some minor shortcomings and advantages in disaster recovery:
MGR/DN abbreviation description:
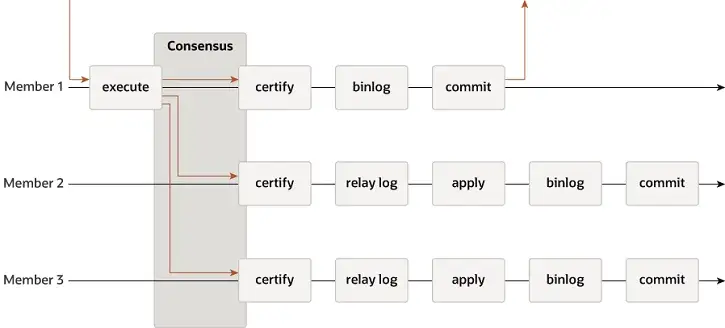
MGR supports single-master and multi-master modes, and fully reuses MySQL's replication system, including Event, Binlog & Relaylog, Apply, Binlog Apply Recovery, and GTID. The key difference from DN is that the entry point for the majority of MGR transaction logs to reach consensus is before the master database transaction is committed.
The reason why MGR adopts the above process is that MGR defaults to multi-master mode and each node can write. Therefore, the Follower node in a single Paxos Group needs to convert the received log into RelayLog first, and then combine it with the write transaction submitted by itself as the Leader to generate a Binlog file in the two-stage group submission process to submit the final transaction.
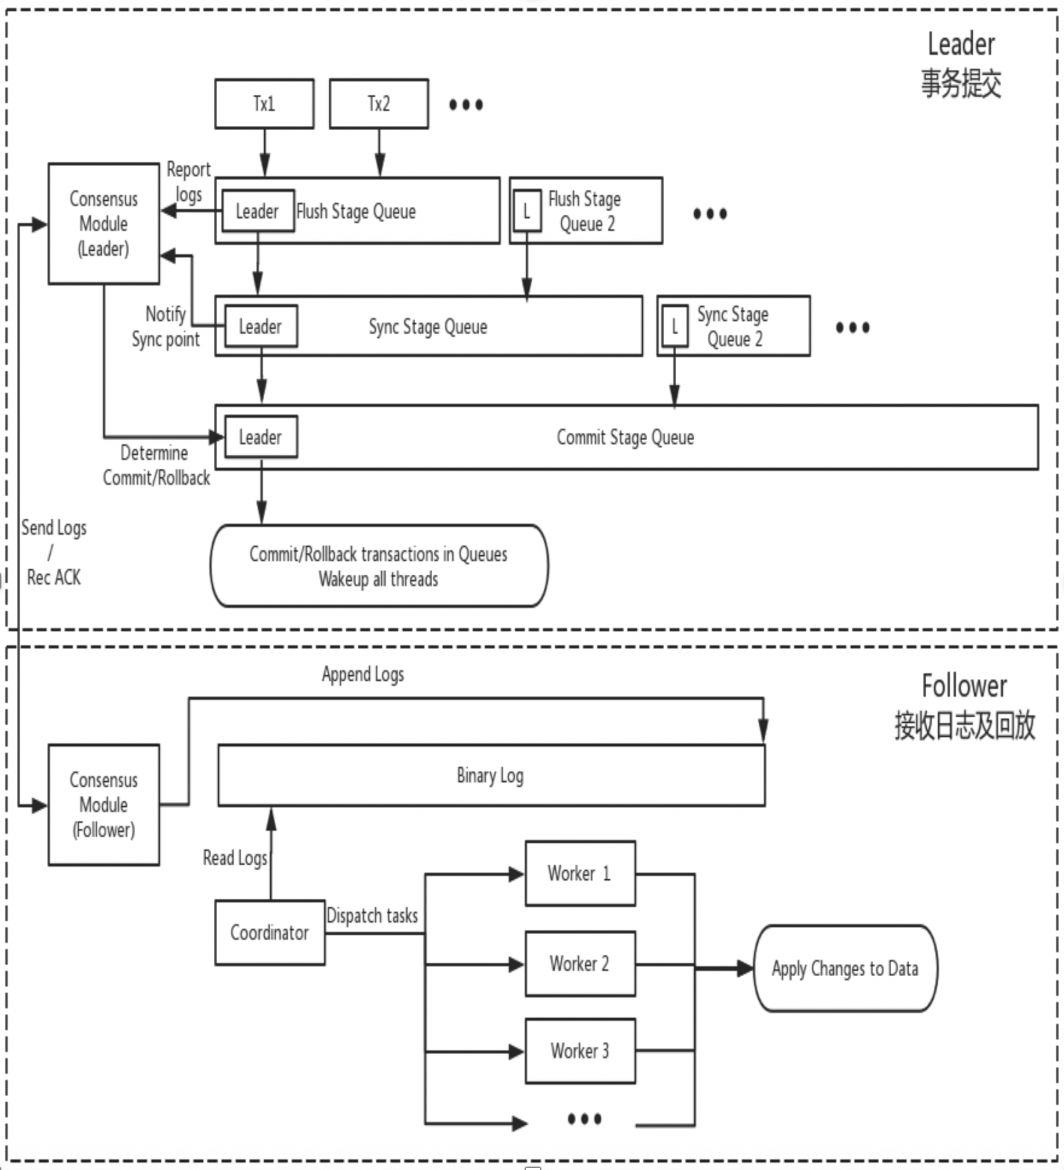
DN reuses the basic data structure and function-level code of MySQL, but closely integrates log replication, log management, log playback, and crash recovery with the X-Paxos protocol to form its own set of majority replication and state machine mechanisms. The key difference from MGR is that the entry point for the DN transaction log majority to reach consensus is during the transaction submission process of the master database.
The reason for this design is that DN currently only supports single-master mode, so the log at the X-Paxos protocol level is the Binlog itself, and the Follower also omits the Relay Log. The data content of its persistent log is equivalent to that of the Leader and other logs.

MGR

DN
Theoretically, both Paxos and Raft can ensure data consistency and that the logs that have reached a majority are not lost after Crash Recovery, but there are still differences in specific projects.
MGR
XCOM completely encapsulates the Paxos protocol, and all its protocol data is cached in memory first. By default, transactions reaching a majority do not require log persistence. In the case of majority downtime or Leader failure, there will be a serious problem of RPO != 0.Assume an extreme scenario:
Under the community default parameters, transactions reaching majority do not require log persistence and do not guarantee RPO=0, which can be considered a trade-off for performance in the XCOM project implementation. To ensure absolute RPO=0, the parameter group_replication_consistency that controls read-write consistency needs to be configured as AFTER, but in this case, in addition to the 1.5 RTT network overhead, transactions reaching majority also require one log IO overhead, which will result in poor performance.
DN
PolarDB-X DN uses X-Paxos to implement the distributed protocol, which is deeply bound to MySQL's Group Commit process. When a transaction is committed, it is mandatory for the majority to confirm that the transaction is persisted before it can be truly committed. Here, the majority means that the Binlog of the master database is persisted to disk, and the IO thread of the standby database receives the log of the master database and persists it to its own Binlog. Therefore, even in extreme scenarios where all nodes fail, data will not be lost, and RPO=0 can be guaranteed.
The RTO time is closely related to the time overhead of the system's cold restart, which is reflected in the specific basic functions:Fault detection mechanism -> crash recovery mechanism -> master election mechanism -> log balancing
MGR
DN
MGR
DN
In single-leader mode, the basic principle followed by the election of the leader in MGR's XCOM and DN X-Paxos, a strong leader mode, is the same - the logs that the cluster has reached consensus on cannot be rolled back. However, there are differences when it comes to logs that have not reached consensus.
MGR
DN
Log balancing means that there is a log replication delay between the primary and standby databases, and the standby database needs to catch up with the logs. For nodes that are restarted and recovered, the standby database is usually used for recovery, and a log replication delay has occurred with the primary database, so the log needs to be caught up with the primary database. For nodes that are physically far away from the Leader, the majority is usually irrelevant to them, and they always have a log replication delay and are constantly catching up with the logs. These situations require specific engineering implementation to ensure that the log replication delay is resolved in a timely manner.
MGR
DN
The playback delay of the standby database is the delay between the time when the same transaction is committed in the primary database and the time when the transaction is applied in the standby database. This tests the performance of applying application logs in the standby database. It affects how long it takes for the standby database to complete its own data application and provide read and write services after becoming the new primary database when an exception occurs.
MGR
DN
Large transactions not only affect the submission of ordinary transactions, but also affect the stability of the entire distributed protocol in a distributed system. In severe cases, a large transaction will cause the entire cluster to be unavailable for a long time.
MGR
DN
MGR
DN

| MGR | DN | ||
| Protocol efficiency | Transaction commit time | 1.5~2.5 RTT | 1 RTT |
| Majority persistence | XCOM Memory Saving | Binlog persistence | |
| reliability | RPO=0 | No guarantee by default | Fully guaranteed |
| Fault detection | All nodes check each other, high network load The heart rate cycle cannot be adjusted | The master node periodically checks other nodes Heart rate parameters are adjustable | |
| Majority Crash Recovery | Human intervention | Automatic recovery | |
| Minority Crash Recovery | Most of the recovery is done automatically, but manual intervention is required in special cases | Automatic recovery | |
| Select the master | Freely specify the order of selecting the master | Freely specify the order of selecting the master | |
| Log tying | The log behind cannot exceed XCOM 1GB cache | BInlog files are not deleted | |
| Standby database playback delay | Two stages + double one, very slow | One stage + double zero, faster | |
| Big Business | The default limit is no more than 143MB | No size limit | |
| form | High availability cost | Full-featured triple replicas, 3 copies of data storage overhead | Logger log copy, 2 copies of data storage |
| Read-only nodes | Implemented with master-slave replication | The protocol comes with a Leaner read-only replica implementation |
MGR was introduced in MySQL 5.7.17, but more MGR-related features are only available in MySQL 8.0, and MySQL 8.0.22 and later versions will be more stable and reliable overall. Therefore, we chose the latest version 8.0.32 of both parties for comparison testing.
Considering the differences in test environment, compilation method, deployment method, operating parameters, and test methods when comparing PolarDB-X DN and MySQL MGR, which may lead to inaccurate test comparison data, this article adopts the following methods in various details:
| Test Preparation | PolarDB-X DN | MySQL MGR[1] |
| Hardware Environment | Use the same physical machine with 96C 754GB memory and SSD disk | |
| operating system | Linux 4.9.168-019.ali3000.alios7.x86_64 | |
| Kernel version | Use a kernel baseline based on the community 8.0.32 version | |
| Compilation method | Compile with the same RelWithDebInfo | |
| Operating parameters | Use the same PolarDB-X official website to sell 32C128G with the same specifications and parameters | |
| Deployment | Single-primary mode | |
Note:
Performance testing is the first thing that everyone pays attention to when selecting a database. Here we use the official sysbench tool to build 16 tables, each with 10 million data, to perform performance testing in OLTP scenarios, and compare the performance of the two in different OLTP scenarios and different concurrency. Considering the different actual deployment situations, we simulate the following four deployment scenarios respectively.
illustrate:
a. Considering the horizontal comparison of the performance of four deployment scenarios, the two-site three-center and three-site three-center deployment modes both adopt a three-replica deployment mode. The actual production business can be expanded to a five-replica deployment mode.
b. Considering the strict restrictions on RPO=0 when actually using high-availability database products, but the default configuration of MGR is RPO<>0, here in each deployment scenario, we continue to add MGR RPO<>0 and RPO=0 comparison tests.
| 1 | 4 | 16 | 64 | 256 | ||
| oltp_read_only | MGR_1 | 688.42 | 2731.68 | 6920.54 | 11492.88 | 14561.71 |
| MGR_0 | 699.27 | 2778.06 | 7989.45 | 11590.28 | 15038.34 | |
| DN | 656.69 | 2612.58 | 7657.03 | 11328.72 | 14771.12 | |
| MGR_0 vs MGR_1 | 1.58% | 1.70% | 15.45% | 0.85% | 3.27% | |
| DN vs MGR_1 | -4.61% | -4.36% | 10.64% | -1.43% | 1.44% | |
| DN vs MGR_0 | -6.09% | -5.96% | -4.16% | -2.26% | -1.78% | |
| oltp_read_write | MGR_1 | 317.85 | 1322.89 | 3464.07 | 5052.58 | 6736.55 |
| MGR_0 | 117.91 | 425.25 | 721.45 | 217.11 | 228.24 | |
| DN | 360.27 | 1485.99 | 3741.36 | 5460.47 | 7536.16 | |
| MGR_0 vs MGR_1 | -62.90% | -67.85% | -79.17% | -95.70% | -96.61% | |
| DN vs MGR_1 | 13.35% | 12.33% | 8.00% | 8.07% | 11.87% | |
| DN vs MGR_0 | 205.55% | 249.44% | 418.59% | 2415.07% | 3201.86% | |
| oltp_write_only | MGR_1 | 761.87 | 2924.1 | 7211.97 | 10374.15 | 16092.02 |
| MGR_0 | 309.83 | 465.44 | 748.68 | 245.75 | 318.48 | |
| DN | 1121.07 | 3787.64 | 7627.26 | 11684.37 | 15137.23 | |
| MGR_0 vs MGR_1 | -59.33% | -84.08% | -89.62% | -97.63% | -98.02% | |
| DN vs MGR_1 | 47.15% | 29.53% | 5.76% | 12.63% | -5.93% | |
| DN vs MGR_0 | 261.83% | 713.78% | 918.76% | 4654.58% | 4652.96% |
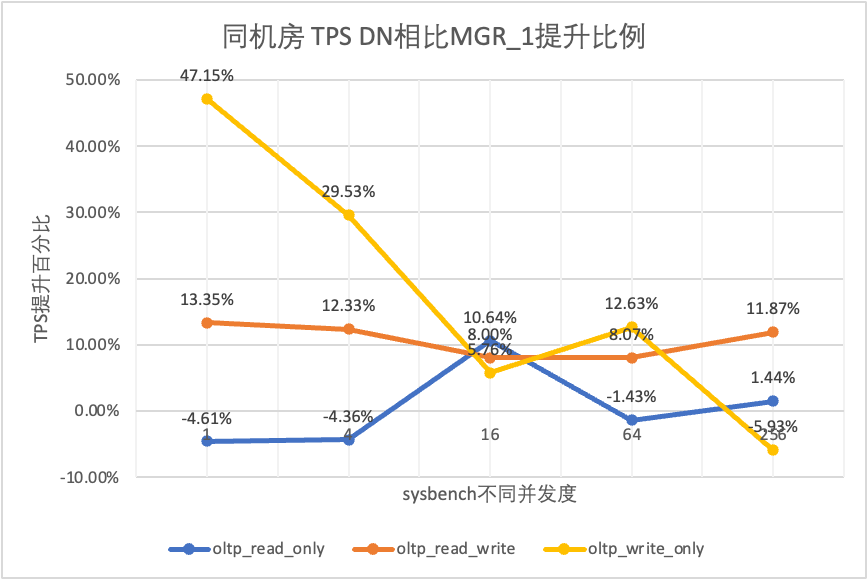
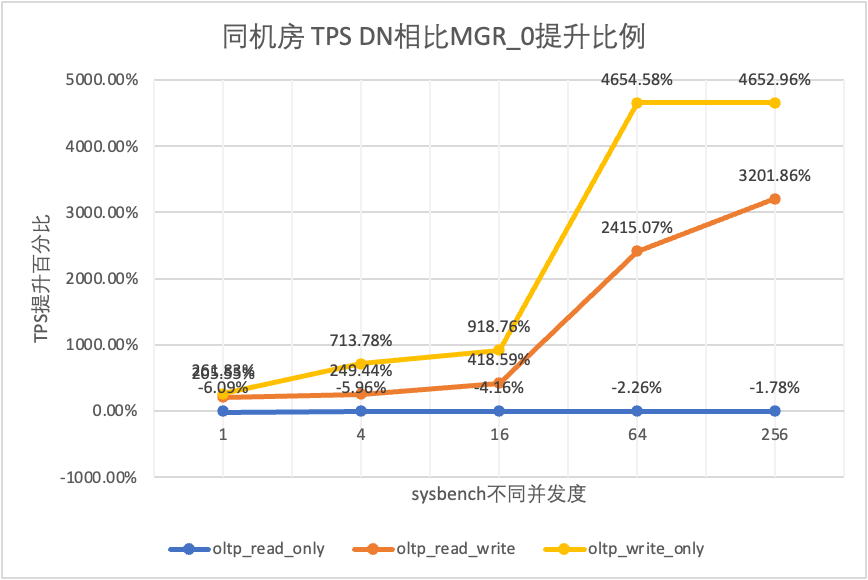
From the test results we can see that:
| TPS Comparison | 1 | 4 | 16 | 64 | 256 | |
| oltp_read_only | MGR_1 | 695.69 | 2697.91 | 7223.43 | 11699.29 | 14542.4 |
| MGR_0 | 691.17 | 2708.6 | 7849.98 | 11636.94 | 14670.99 | |
| DN | 645.11 | 2611.15 | 7628.39 | 11294.36 | 14647.22 | |
| MGR_0 vs MGR_1 | -0.65% | 0.40% | 8.67% | -0.53% | 0.88% | |
| DN vs MGR_1 | -7.27% | -3.22% | 5.61% | -3.46% | 0.72% | |
| DN vs MGR_0 | -6.66% | -3.60% | -2.82% | -2.94% | -0.16% | |
| oltp_read_write | MGR_1 | 171.37 | 677.77 | 2230 | 3872.87 | 6096.62 |
| MGR_0 | 117.11 | 469.17 | 765.64 | 813.85 | 812.46 | |
| DN | 257.35 | 1126.07 | 3296.49 | 5135.18 | 7010.37 | |
| MGR_0 vs MGR_1 | -31.66% | -30.78% | -65.67% | -78.99% | -86.67% | |
| DN vs MGR_1 | 50.17% | 66.14% | 47.82% | 32.59% | 14.99% | |
| DN vs MGR_0 | 119.75% | 140.01% | 330.55% | 530.97% | 762.86% | |
| oltp_write_only | MGR_1 | 248.37 | 951.88 | 2791.07 | 5989.57 | 11666.16 |
| MGR_0 | 162.92 | 603.72 | 791.27 | 828.16 | 866.65 | |
| DN | 553.69 | 2173.18 | 5836.64 | 10588.9 | 13241.74 | |
| MGR_0 vs MGR_1 | -34.40% | -36.58% | -71.65% | -86.17% | -92.57% | |
| DN vs MGR_1 | 122.93% | 128.30% | 109.12% | 76.79% | 13.51% | |
| DN vs MGR_0 | 239.85% | 259.96% | 637.63% | 1178.61% | 1427.92% |


From the test results we can see that:
| TPS Comparison | 1 | 4 | 16 | 64 | 256 | |
| oltp_read_only | MGR_1 | 687.76 | 2703.5 | 7030.37 | 11580.36 | 14674.7 |
| MGR_0 | 687.17 | 2744.41 | 7908.44 | 11535.35 | 14656 | |
| DN | 657.06 | 2610.58 | 7591.21 | 11174.94 | 14545.45 | |
| MGR_0 vs MGR_1 | -0.09% | 1.51% | 12.49% | -0.39% | -0.13% | |
| DN vs MGR_1 | -4.46% | -3.44% | 7.98% | -3.50% | -0.88% | |
| DN vs MGR_0 | -4.38% | -4.88% | -4.01% | -3.12% | -0.75% | |
| oltp_read_write | MGR_1 | 29.13 | 118.64 | 572.25 | 997.92 | 2253.19 |
| MGR_0 | 26.94 | 90.8 | 313.64 | 419.17 | 426.7 | |
| DN | 254.87 | 1146.57 | 3339.83 | 5307.85 | 7171.95 | |
| MGR_0 vs MGR_1 | -7.52% | -23.47% | -45.19% | -58.00% | -81.06% | |
| DN vs MGR_1 | 774.94% | 866.43% | 483.63% | 431.89% | 218.30% | |
| DN vs MGR_0 | 846.07% | 1162.74% | 964.86% | 1166.28% | 1580.79% | |
| oltp_write_only | MGR_1 | 30.81 | 145.54 | 576.61 | 1387.64 | 3705.51 |
| MGR_0 | 28.68 | 108.86 | 387.48 | 470.5 | 476.4 | |
| DN | 550.11 | 2171.64 | 5866.41 | 10381.72 | 14478.38 | |
| MGR_0 vs MGR_1 | -6.91% | -25.20% | -32.80% | -66.09% | -87.14% | |
| DN vs MGR_1 | 1685.49% | 1392.13% | 917.40% | 648.16% | 290.73% | |
| DN vs MGR_0 | 1818.10% | 1894.89% | 1413.99% | 2106.53% | 2939.12% |
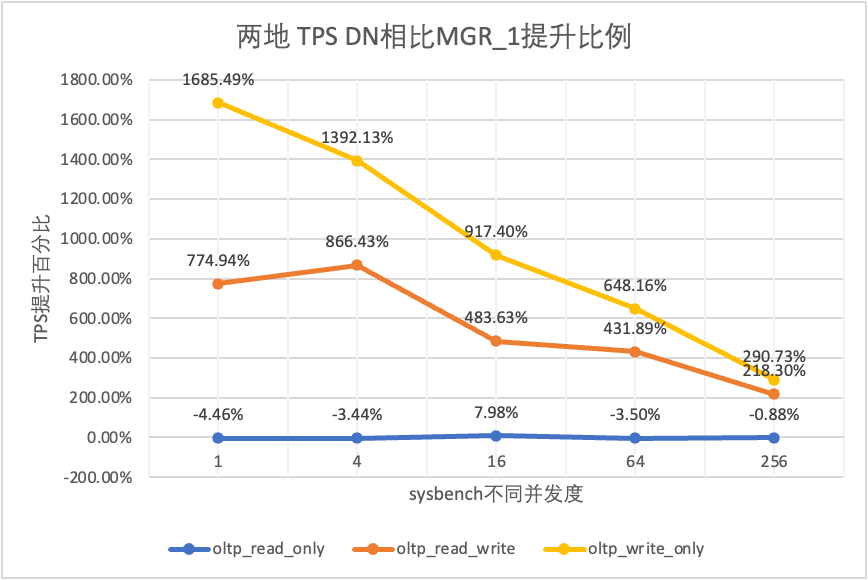
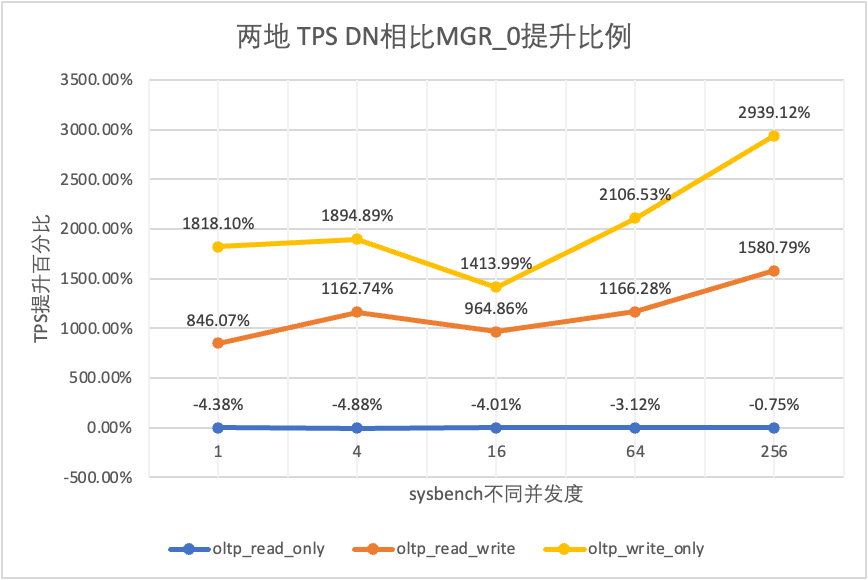
From the test results we can see that:
| TPS Comparison | 1 | 4 | 16 | 64 | 256 | |
| oltp_read_only | MGR_1 | 688.49 | 2747.69 | 7853.91 | 11722.71 | 15292.73 |
| MGR_0 | 687.66 | 2756.3 | 8005.11 | 11567.89 | 15055.69 | |
| DN | 656.06 | 2600.35 | 7657.85 | 11227.56 | 14562.86 | |
| MGR_0 vs MGR_1 | -0.12% | 0.31% | 1.93% | -1.32% | -1.55% | |
| DN vs MGR_1 | -4.71% | -5.36% | -2.50% | -4.22% | -4.77% | |
| DN vs MGR_0 | -4.60% | -5.66% | -4.34% | -2.94% | -3.27% | |
| oltp_read_write | MGR_1 | 26.01 | 113.98 | 334.95 | 693.34 | 2030.6 |
| MGR_0 | 23.93 | 110.17 | 475.68 | 497.92 | 511.99 | |
| DN | 122.06 | 525.88 | 1885.7 | 3314.9 | 5889.79 | |
| MGR_0 vs MGR_1 | -8.00% | -3.34% | 42.02% | -28.19% | -74.79% | |
| DN vs MGR_1 | 369.28% | 361.38% | 462.98% | 378.11% | 190.05% | |
| DN vs MGR_0 | 410.07% | 377.34% | 296.42% | 565.75% | 1050.37% | |
| oltp_write_only | MGR_1 | 27.5 | 141.64 | 344.05 | 982.47 | 2889.85 |
| MGR_0 | 25.52 | 155.43 | 393.35 | 470.92 | 504.68 | |
| DN | 171.74 | 535.83 | 1774.58 | 4328.44 | 9429.24 | |
| MGR_0 vs MGR_1 | -7.20% | 9.74% | 14.33% | -52.07% | -82.54% | |
| DN vs MGR_1 | 524.51% | 278.30% | 415.79% | 340.57% | 226.29% | |
| DN vs MGR_0 | 572.96% | 244.74% | 351.15% | 819.15% | 1768.36% |
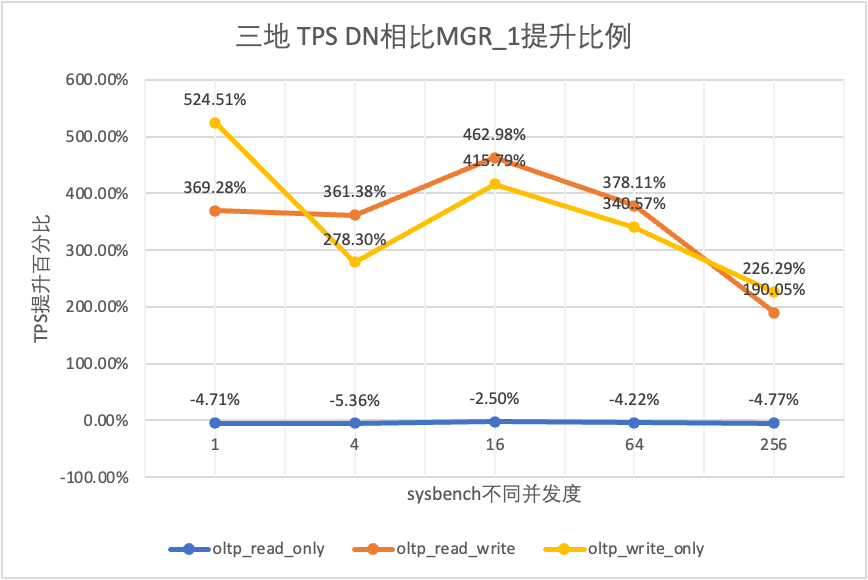
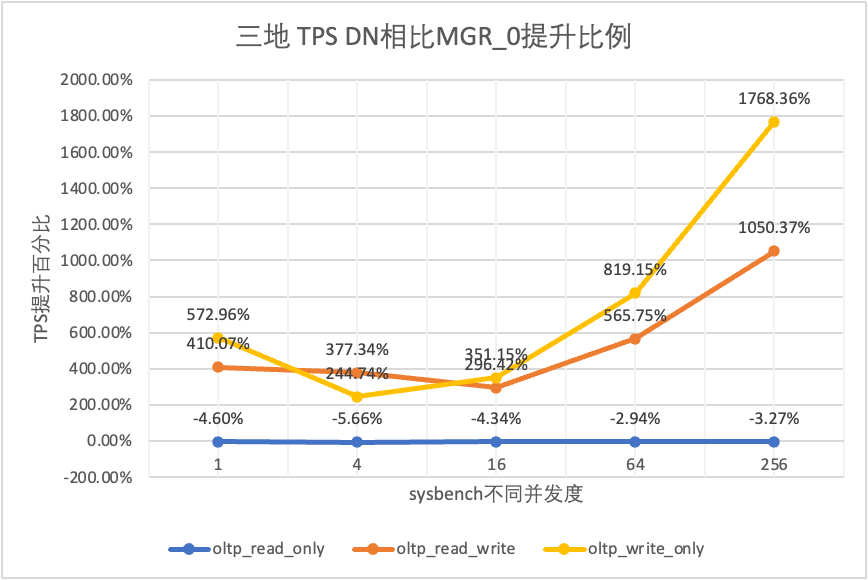
From the test results we can see that:
In order to clearly compare the performance changes under different deployment methods, we selected the TPS data of MGR and DN under different deployment methods under oltp_write_only scenario 256 concurrency in the above test, took the data of the computer room test as the baseline, and calculated the ratio of TPS data under different deployment methods compared with the baseline, so as to perceive the performance changes when deploying across cities.
| MGR_1 (256 concurrent) | DN (256 concurrent) | Performance advantages of DN compared to MGR | |
| Same computer room | 16092.02 | 15137.23 | -5.93% |
| Three centers in the same city | 11666.16 (72.50%) | 13241.74 (87.48%) | +13.50% |
| Two locations, three centers | 3705.51 (23.03%) | 14478.38 (95.64%) | +290.72% |
| Three locations, three centers | 2889.85 (17.96%) | 9429.24 (62.29%) | +226.28% |
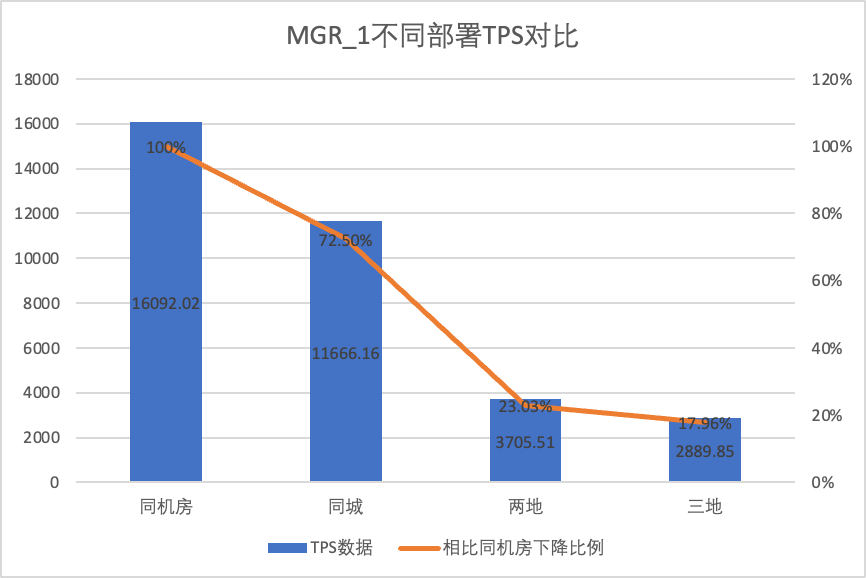
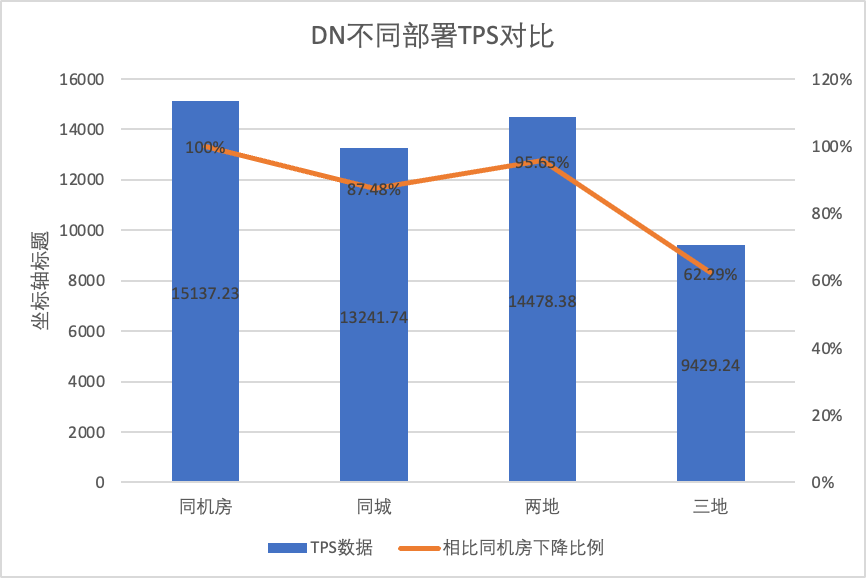
From the test results we can see that:
In actual use, we not only pay attention to the performance data, but also need to pay attention to the performance jitter. After all, if the jitter is like a roller coaster, the actual user experience will be very poor. We monitor and display the real-time output data of TPS. Considering that the sysbenc tool itself does not support the output of performance jitter monitoring data, we use the mathematical coefficient of variation as a comparison indicator:
Taking the oltp_read_write scenario with 256 concurrency as an example, we statistically analyzed the TPS jitter of MGR_1 (RPO<>0) and DN (RPO=0) in five deployment modes: same data center, three centers in the same city, three centers in two locations, and three centers in three locations. The actual jitter graph is as follows, and the actual jitter indicator data for each scenario is as follows
| CV | Same computer room | Three centers in the same city | Two locations, three centers | Three locations, three centers |
| MGR_1 | 10.04% | 8.96% | 6.02% | 8.63% |
| DN | 3.68% | 3.78% | 2.55% | 4.05% |
| MGR_1/DN | 272.83% | 237.04% | 236.08% | 213.09% |
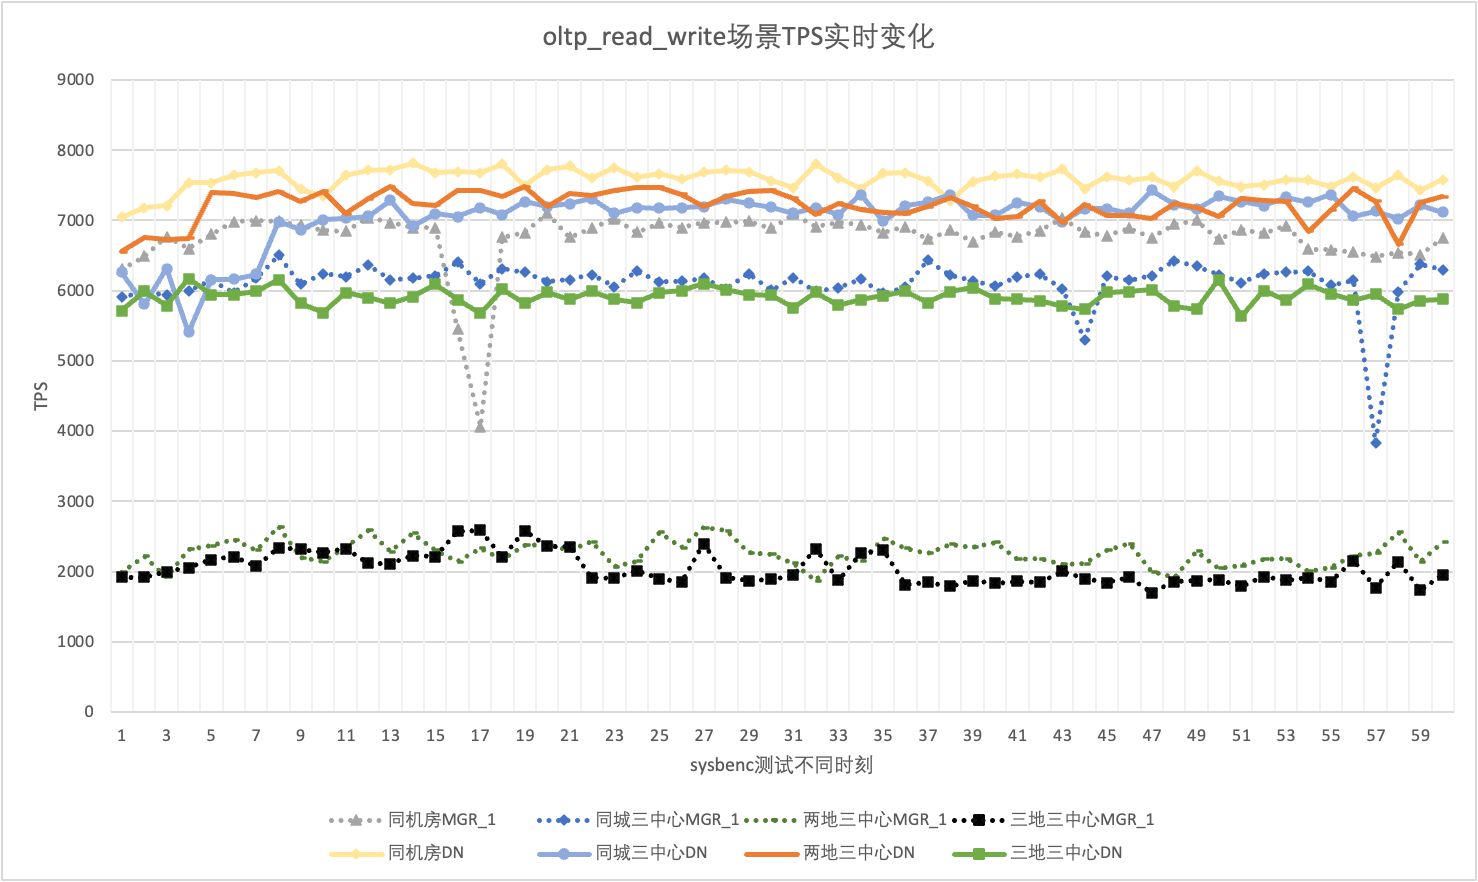
From the test results we can see that:
The core feature of a distributed database is high availability. The failure of any node in the cluster does not affect the overall availability. For a typical deployment of three nodes with one master and two backups in the same data center, we tried to test the availability of the following three scenarios:
In the case of no load, kill the leader, monitor the status changes of each node in the cluster and whether it is writable,
| MGR | DN | |
| Normal start | 0 | 0 |
| kill leader | 0 | 0 |
| Time when abnormal node is discovered | 5 | 5 |
| Time to reduce from 3 nodes to 2 nodes | 23 | 8 |
| MGR | DN | |
| Normal start | 0 | 0 |
| kill leader, automatically pull up | 0 | 0 |
| Time when abnormal node is discovered | 5 | 5 |
| Time to reduce from 3 nodes to 2 nodes | 23 | 8 |
| Time for node 2 to recover node 3 | 37 | 15 |

From the test results, we can see that under no pressure:
Use sysbench to perform concurrent stress testing of 16 threads in the oltp_read_write scenario. At the 10th second in the figure, manually kill a standby node and observe the real-time TPS data output by sysbench.
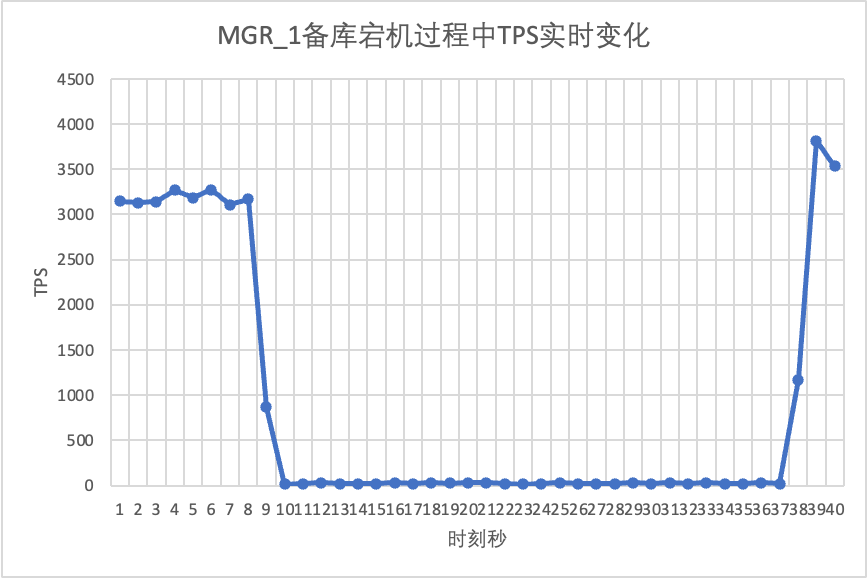


From the test results chart we can see:
Continuing the test, we restarted the standby database and observed the changes in the TPS data of the primary database.
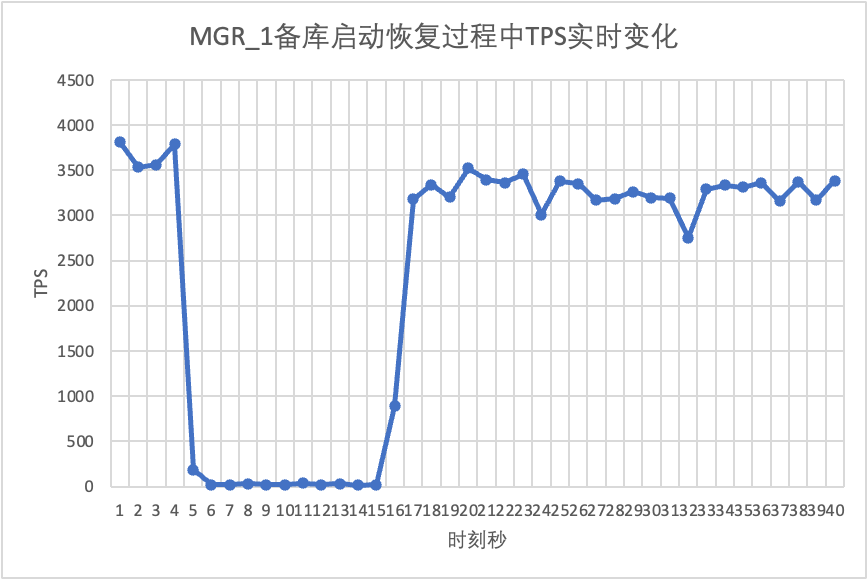
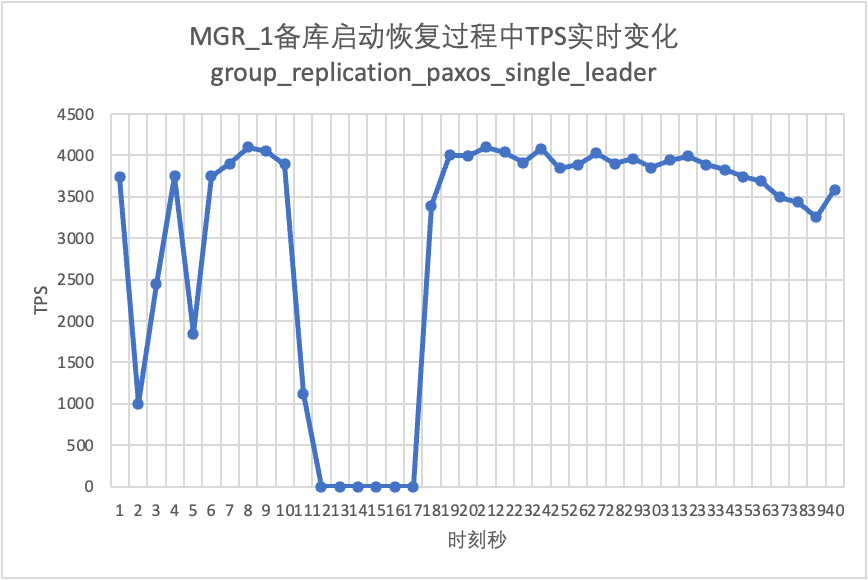
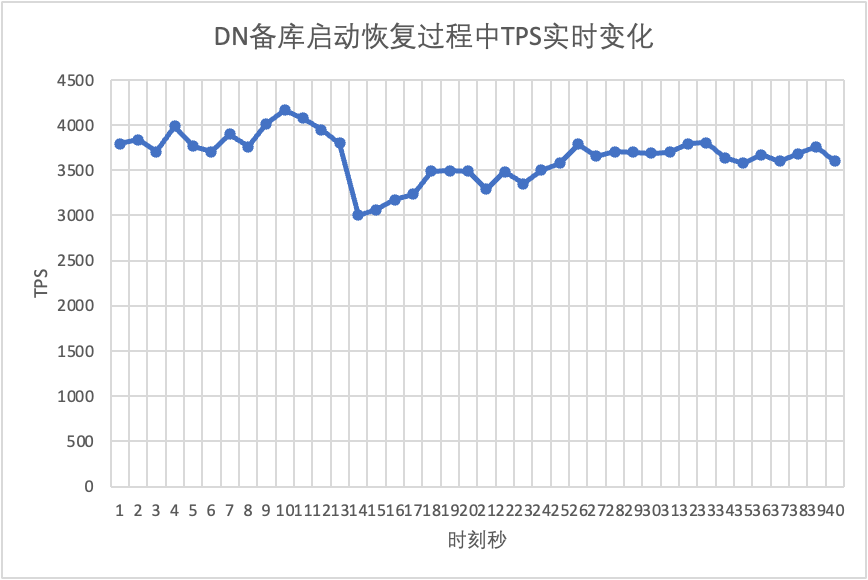
From the test results chart we can see:
In order to construct the MGR majority failure RPO<>0 scenario, we use the MTR Case method provided by the community to perform fault injection testing on MGR. The designed case is as follows:
- --echo
- --echo ############################################################
- --echo # 1. Deploy a 3 members group in single primary mode.
- --source include/have_debug.inc
- --source include/have_group_replication_plugin.inc
- --let $group_replication_group_name= aaaaaaaa-aaaa-aaaa-aaaa-aaaaaaaaaaaa
- --let $rpl_group_replication_single_primary_mode=1
- --let $rpl_skip_group_replication_start= 1
- --let $rpl_server_count= 3
- --source include/group_replication.inc
-
- --let $rpl_connection_name= server1
- --source include/rpl_connection.inc
- --let $server1_uuid= `SELECT @@server_uuid`
- --source include/start_and_bootstrap_group_replication.inc
-
- --let $rpl_connection_name= server2
- --source include/rpl_connection.inc
- --source include/start_group_replication.inc
-
- --let $rpl_connection_name= server3
- --source include/rpl_connection.inc
- --source include/start_group_replication.inc
-
- --echo
- --echo ############################################################
- --echo # 2. Init data
- --let $rpl_connection_name = server1
- --source include/rpl_connection.inc
- CREATE TABLE t1 (c1 INT PRIMARY KEY);
- INSERT INTO t1 VALUES(1);
-
- --source include/rpl_sync.inc
- SELECT * FROM t1;
-
- --let $rpl_connection_name = server2
- --source include/rpl_connection.inc
- SELECT * FROM t1;
-
- --let $rpl_connection_name = server3
- --source include/rpl_connection.inc
- SELECT * FROM t1;
-
- --echo
- --echo ############################################################
- --echo # 3. Mock crash majority members
-
- --echo # server 2 wait before write relay log
- --let $rpl_connection_name = server2
- --source include/rpl_connection.inc
- SET GLOBAL debug = '+d,wait_in_the_middle_of_trx';
-
- --echo # server 3 wait before write relay log
- --let $rpl_connection_name = server3
- --source include/rpl_connection.inc
- SET GLOBAL debug = '+d,wait_in_the_middle_of_trx';
-
-
- --echo # server 1 commit new transaction
- --let $rpl_connection_name = server1
- --source include/rpl_connection.inc
- INSERT INTO t1 VALUES(2);
- # server 1 commit t1(c1=2) record
- SELECT * FROM t1;
- select CHANNEL_NAME,MEMBER_HOST,MEMBER_PORT,MEMBER_STATE,MEMBER_ROLE,MEMBER_VERSION,MEMBER_COMMUNICATION_STACK from performance_schema.replication_group_members order by MEMBER_PORT;
- --echo # server 1 crash
- --source include/kill_mysqld.inc
-
- --echo # sleep enough time for electing new leader
- sleep 60;
-
- --echo
- --echo # server 3 check
- --let $rpl_connection_name = server3
- --source include/rpl_connection.inc
- SELECT * FROM t1;
- select CHANNEL_NAME,MEMBER_HOST,MEMBER_PORT,MEMBER_STATE,MEMBER_ROLE,MEMBER_VERSION,MEMBER_COMMUNICATION_STACK from performance_schema.replication_group_members order by MEMBER_PORT;
- --echo # server 3 crash and restart
- --source include/kill_and_restart_mysqld.inc
-
- --echo # sleep enough time for electing new leader
- sleep 60;
-
- --echo
- --echo # server 2 check
- --let $rpl_connection_name = server2
- --source include/rpl_connection.inc
- SELECT * FROM t1;
- select CHANNEL_NAME,MEMBER_HOST,MEMBER_PORT,MEMBER_STATE,MEMBER_ROLE,MEMBER_VERSION,MEMBER_COMMUNICATION_STACK from performance_schema.replication_group_members order by MEMBER_PORT;
- --echo # server 2 crash and restart
- --source include/kill_and_restart_mysqld.inc
-
- --echo # sleep enough time for electing new leader
- sleep 60;
-
- --echo
- --echo ############################################################
- --echo # 4. Check alive members, lost t1(c1=2) record
-
- --echo # server 3 check
- --let $rpl_connection_name= server3
- --source include/rpl_connection.inc
- select CHANNEL_NAME,MEMBER_HOST,MEMBER_PORT,MEMBER_STATE,MEMBER_ROLE,MEMBER_VERSION,MEMBER_COMMUNICATION_STACK from performance_schema.replication_group_members order by MEMBER_PORT;
- --echo # server 3 lost t1(c1=2) record
- SELECT * FROM t1;
-
- --echo
- --echo # server 2 check
- --let $rpl_connection_name = server2
- --source include/rpl_connection.inc
- select CHANNEL_NAME,MEMBER_HOST,MEMBER_PORT,MEMBER_STATE,MEMBER_ROLE,MEMBER_VERSION,MEMBER_COMMUNICATION_STACK from performance_schema.replication_group_members order by MEMBER_PORT;
- --echo # server 2 lost t1(c1=2) record
- SELECT * FROM t1;
- !include ../my.cnf
-
- [mysqld.1]
- loose-group_replication_member_weight=100
-
- [mysqld.2]
- loose-group_replication_member_weight=90
-
- [mysqld.3]
- loose-group_replication_member_weight=80
-
- [ENV]
- SERVER_MYPORT_3= @mysqld.3.port
- SERVER_MYSOCK_3= @mysqld.3.socket
The results of the case operation are as follows:
-
- ############################################################
- # 1. Deploy a 3 members group in single primary mode.
- include/group_replication.inc [rpl_server_count=3]
- Warnings:
- Note #### Sending passwords in plain text without SSL/TLS is extremely insecure.
- Note #### Storing MySQL user name or password information in the master info repository is not secure and is therefore not recommended. Please consider using the USER and PASSWORD connection options for START SLAVE; see the 'START SLAVE Syntax' in the MySQL Manual for more information.
- [connection server1]
- [connection server1]
- include/start_and_bootstrap_group_replication.inc
- [connection server2]
- include/start_group_replication.inc
- [connection server3]
- include/start_group_replication.inc
-
- ############################################################
- # 2. Init data
- [connection server1]
- CREATE TABLE t1 (c1 INT PRIMARY KEY);
- INSERT INTO t1 VALUES(1);
- include/rpl_sync.inc
- SELECT * FROM t1;
- c1
- 1
- [connection server2]
- SELECT * FROM t1;
- c1
- 1
- [connection server3]
- SELECT * FROM t1;
- c1
- 1
-
- ############################################################
- # 3. Mock crash majority members
- # server 2 wait before write relay log
- [connection server2]
- SET GLOBAL debug = '+d,wait_in_the_middle_of_trx';
- # server 3 wait before write relay log
- [connection server3]
- SET GLOBAL debug = '+d,wait_in_the_middle_of_trx';
- # server 1 commit new transaction
- [connection server1]
- INSERT INTO t1 VALUES(2);
- SELECT * FROM t1;
- c1
- 1
- 2
- select CHANNEL_NAME,MEMBER_HOST,MEMBER_PORT,MEMBER_STATE,MEMBER_ROLE,MEMBER_VERSION,MEMBER_COMMUNICATION_STACK from performance_schema.replication_group_members order by MEMBER_PORT;
- CHANNEL_NAME MEMBER_HOST MEMBER_PORT MEMBER_STATE MEMBER_ROLE MEMBER_VERSION MEMBER_COMMUNICATION_STACK
- group_replication_applier 127.0.0.1 13000 ONLINE PRIMARY 8.0.32 XCom
- group_replication_applier 127.0.0.1 13002 ONLINE SECONDARY 8.0.32 XCom
- group_replication_applier 127.0.0.1 13004 ONLINE SECONDARY 8.0.32 XCom
- # server 1 crash
- # Kill the server
- # sleep enough time for electing new leader
-
- # server 3 check
- [connection server3]
- SELECT * FROM t1;
- c1
- 1
- select CHANNEL_NAME,MEMBER_HOST,MEMBER_PORT,MEMBER_STATE,MEMBER_ROLE,MEMBER_VERSION,MEMBER_COMMUNICATION_STACK from performance_schema.replication_group_members order by MEMBER_PORT;
- CHANNEL_NAME MEMBER_HOST MEMBER_PORT MEMBER_STATE MEMBER_ROLE MEMBER_VERSION MEMBER_COMMUNICATION_STACK
- group_replication_applier 127.0.0.1 13002 ONLINE PRIMARY 8.0.32 XCom
- group_replication_applier 127.0.0.1 13004 ONLINE SECONDARY 8.0.32 XCom
- # server 3 crash and restart
- # Kill and restart
- # sleep enough time for electing new leader
-
- # server 2 check
- [connection server2]
- SELECT * FROM t1;
- c1
- 1
- select CHANNEL_NAME,MEMBER_HOST,MEMBER_PORT,MEMBER_STATE,MEMBER_ROLE,MEMBER_VERSION,MEMBER_COMMUNICATION_STACK from performance_schema.replication_group_members order by MEMBER_PORT;
- CHANNEL_NAME MEMBER_HOST MEMBER_PORT MEMBER_STATE MEMBER_ROLE MEMBER_VERSION MEMBER_COMMUNICATION_STACK
- group_replication_applier 127.0.0.1 13002 ONLINE PRIMARY 8.0.32 XCom
- group_replication_applier 127.0.0.1 13004 UNREACHABLE SECONDARY 8.0.32 XCom
- # server 2 crash and restart
- # Kill and restart
- # sleep enough time for electing new leader
-
- ############################################################
- # 4. Check alive members, lost t1(c1=2) record
- # server 3 check
- [connection server3]
- select CHANNEL_NAME,MEMBER_HOST,MEMBER_PORT,MEMBER_STATE,MEMBER_ROLE,MEMBER_VERSION,MEMBER_COMMUNICATION_STACK from performance_schema.replication_group_members order by MEMBER_PORT;
- CHANNEL_NAME MEMBER_HOST MEMBER_PORT MEMBER_STATE MEMBER_ROLE MEMBER_VERSION MEMBER_COMMUNICATION_STACK
- group_replication_applier NULL OFFLINE
- # server 3 lost t1(c1=2) record
- SELECT * FROM t1;
- c1
- 1
-
- # server 2 check
- [connection server2]
- select CHANNEL_NAME,MEMBER_HOST,MEMBER_PORT,MEMBER_STATE,MEMBER_ROLE,MEMBER_VERSION,MEMBER_COMMUNICATION_STACK from performance_schema.replication_group_members order by MEMBER_PORT;
- CHANNEL_NAME MEMBER_HOST MEMBER_PORT MEMBER_STATE MEMBER_ROLE MEMBER_VERSION MEMBER_COMMUNICATION_STACK
- group_replication_applier NULL OFFLINE
- # server 2 lost t1(c1=2) record
- SELECT * FROM t1;
- c1
- 1
The logic of reproducing the case of missing numbers is as follows:
According to the above case, for MGR, when the majority of parties fail and the primary database is unavailable, after the standby database is restored, there is a situation where the RPO of data loss is <> 0, and the records that were originally returned to the client for successful commit are lost.
For DN, the achievement of majority requires that the logs are persisted in the majority, so even in the above scenario, data will not be lost and RPO=0 can be guaranteed.
In the traditional master-slave mode of MySQL, the slave database generally includes IO threads and Apply threads. After the introduction of the Paxos protocol, the IO thread is replaced to synchronize the binlogs of the master and slave databases. The replication delay of the slave database mainly depends on the overhead of the Apply playback of the slave database, which is called the slave database playback delay.
We use sysbench to test the oltp_write_only scenario, and test the duration of the delay in the standby database playback when the number of events is different under 100 concurrent transactions. The standby database playback delay time is determined by monitoring the APPLYING_TRANSACTION_ORIGINAL_COMMIT_TIMESTAMP column of the performance_schema.replication_applier_status_by_worker table to check in real time whether each worker is working and whether the replication is finished.

From the test results chart we can see:
| MGR | DN | ||
| performance | Read Transaction | Flat | Flat |
| Write Transactions | When RPO<>0, the performance is not as good as DN When RPO=0, the performance is far worse than DN Cross-city deployment performance drops significantly by 27% to 82% | Write transaction performance is much higher than MGR The performance of cross-city deployment is slightly reduced by 4% to 37%. | |
| Jitter | The performance jitter is severe, with a jitter range of 6~10% | Relatively stable 3%, only half of MGR | |
| RTO | The main database is down | Anomalies were detected in 5 seconds and the number of nodes was reduced to two in 23 seconds. | Anomalies were detected in 5 seconds and the number of nodes was reduced to two in 8 seconds. |
| Restart the master database | The abnormality was discovered in 5 seconds and the three nodes were restored in 37 seconds. | The abnormality was found in 5 seconds and the three nodes were restored in 15 seconds. | |
| Backup database downtime | The traffic of the main database drops to 0 for 20 seconds You need to explicitly enable group_replication_paxos_single_leader to alleviate this problem. | Maintain high availability of the main database | |
| Restarting the Standby Database | The traffic of the main database drops to 0 for 10 seconds Explicitly enabling group_replication_paxos_single_leader is also invalid | Maintain high availability of the main database | |
| RPO | Case Recurrence | When the majority of the servers are down, RPO<>0 You can’t have both performance and RPO=0 | RPO = 0 |
| Backup database delay | Backup database playback takes time | The delay between the master and the backup is very large. You can’t have both performance and active/standby latency | The total time consumed for overall backup database playback is 4% of MGR, which is 25 times that of MGR. |
| parameter | key parameter |
| Default configuration, no need for professional customization |
After in-depth technical analysis and performance comparison,PolarDB-X DN has demonstrated many advantages over MySQL MGR in terms of performance, correctness, availability, and resource overhead by relying on its self-developed X-Paxos protocol and a series of optimized designs. However, MGR also occupies an important position in the MySQL ecosystem, but it is necessary to consider various situations such as backup database downtime jitter, cross-computer room disaster recovery performance fluctuations, and stability. Therefore, if you want to make good use of MGR, you must have the support of professional technology and operation and maintenance teams.
When faced with large-scale, high-concurrency, and high-availability requirements, the PolarDB-X storage engine, with its unique technical advantages and excellent performance, is more suitable than MGR in out-of-the-box scenarios.PolarDB-XThe centralized (standard edition) based on DN has achieved a good balance between functionality and performance, making it a highly competitive database solution.

I have devoted myself to the research of technology for more than 30 years. I am proficient in various languages such as Java, Linux, JavaScript, PHP, CSS, etc. I have made many contributions in the field of open source. I have established a developer documentation site to share some problems in technology development for everyone to read.

