2024-07-12
한어Русский языкEnglishFrançaisIndonesianSanskrit日本語DeutschPortuguêsΕλληνικάespañolItalianoSuomalainenLatina

CatBoostCatBoost is a machine learning algorithm based on gradient boosting developed by Yandex (a Russian Internet company whose search engine once had more than 60% market share in Russia and also provides other Internet products and services). CatBoost is particularly good at processing categorical features and can effectively avoid overfitting and data leakage problems. The full name of CatBoost is "Categorical Boosting", and it was originally designed to perform better when processing data containing a large number of categorical features.
Handling categorical features: CatBoost can directly process categorical features without additional encoding (such as one-hot encoding).
Avoid overfitting:CatBoost adopts a new method to process category features, which effectively reduces overfitting.
Efficiency: CatBoost performs well in both training speed and prediction speed.
Supports CPU and GPU training: CatBoost can run on the CPU or use the GPU for accelerated training.
Automatically handle missing values: CatBoost can automatically handle missing values without the need for additional preprocessing steps.
The core principle of CatBoost is based on the gradient boosted decision tree (GBDT), but it has made innovations in handling categorical features and avoiding overfitting. The following are some key technical points:
Category feature processing:
CatBoost introduces a method called “mean encoding” to compute new features based on the mean of the categories.
Using a technique called “target encoding”, when converting categorical features into numerical features, the risk of data leakage is reduced by using the average of the target values.
During training, the data is processed using statistical information to avoid direct encoding using the target variable.
Ordered Boosting:
To prevent data leakage and overfitting, CatBoost processes the data in an orderly manner during training.
Ordered boosting works by randomly shuffling the data during training and ensuring that the model only sees past data at a given moment and does not use future information to make decisions.
Computational Optimization:
CatBoost speeds up the feature calculation process by pre-computation and caching.
It supports CPU and GPU training and can perform well on large-scale datasets.
The following is a basic example of using CatBoost for classification tasks. We use the Auto MPG (Miles Per Gallon) dataset, which is a classic regression problem dataset commonly used in machine learning and statistical analysis. This dataset records the fuel efficiency (i.e., miles per gallon) of different models of cars and multiple other related features.
Dataset characteristics:
mpg: Miles per gallon (target variable).
cylinders: Number of cylinders, indicating the number of cylinders in the engine.
displacement: Engine displacement (cubic inches).
horsepower: Engine power (horsepower).
weight: Vehicle weight in pounds.
acceleration: Acceleration time from 0 to 60 mph (seconds).
model_year: The year the vehicle was manufactured.
origin: Vehicle origin (1=United States, 2=Europe, 3=Japan).
The first few rows of the dataset:
- mpg cylinders displacement horsepower weight acceleration model_year origin
- 0 18.0 8 307.0 130.0 3504.0 12.0 70 1
- 1 15.0 8 350.0 165.0 3693.0 11.5 70 1
- 2 18.0 8 318.0 150.0 3436.0 11.0 70 1
- 3 16.0 8 304.0 150.0 3433.0 12.0 70 1
- 4 17.0 8 302.0 140.0 3449.0 10.5 70 1
-
Code example:
- import pandas as pd # 导入Pandas库,用于数据处理
- import numpy as np # 导入Numpy库,用于数值计算
- from sklearn.model_selection import train_test_split # 从sklearn库导入train_test_split,用于划分数据集
- from sklearn.metrics import mean_squared_error, mean_absolute_error # 导入均方误差和平均绝对误差,用于评估模型性能
- from catboost import CatBoostRegressor # 导入CatBoost库中的CatBoostRegressor,用于回归任务
- import matplotlib.pyplot as plt # 导入Matplotlib库,用于绘图
- import seaborn as sns # 导入Seaborn库,用于绘制统计图
-
- # 设置随机种子以便结果复现
- np.random.seed(42)
-
- # 从UCI机器学习库加载Auto MPG数据集
- url = "http://archive.ics.uci.edu/ml/machine-learning-databases/auto-mpg/auto-mpg.data"
- column_names = ['mpg', 'cylinders', 'displacement', 'horsepower', 'weight', 'acceleration', 'model_year', 'origin']
- data = pd.read_csv(url, names=column_names, na_values='?', comment='t', sep=' ', skipinitialspace=True)
-
- # 查看数据集的前几行
- print(data.head())
-
- # 处理缺失值
- data = data.dropna()
-
- # 特征和目标变量
- X = data.drop('mpg', axis=1) # 特征变量
- y = data['mpg'] # 目标变量
-
- # 将类别特征转换为字符串类型(CatBoost可以直接处理类别特征)
- X['cylinders'] = X['cylinders'].astype(str)
- X['model_year'] = X['model_year'].astype(str)
- X['origin'] = X['origin'].astype(str)
-
- # 将数据集划分为训练集和测试集
- X_train, X_test, y_train, y_test = train_test_split(X, y, test_size=0.2, random_state=42)
-
- # 定义CatBoost回归器
- model = CatBoostRegressor(
- iterations=1000, # 迭代次数
- learning_rate=0.1, # 学习率
- depth=6, # 决策树深度
- loss_function='RMSE', # 损失函数
- verbose=100 # 输出训练过程信息
- )
-
- # 训练模型
- model.fit(X_train, y_train, eval_set=(X_test, y_test), early_stopping_rounds=50)
-
- # 进行预测
- y_pred = model.predict(X_test)
-
- # 评估模型性能
- mse = mean_squared_error(y_test, y_pred) # 计算均方误差
- mae = mean_absolute_error(y_test, y_pred) # 计算平均绝对误差
-
- # 打印模型的评估结果
- print(f'Mean Squared Error (MSE): {mse:.4f}')
- print(f'Mean Absolute Error (MAE): {mae:.4f}')
-
- # 绘制真实值与预测值的对比图
- plt.figure(figsize=(10, 6))
- plt.scatter(y_test, y_pred, alpha=0.5) # 绘制散点图
- plt.plot([y_test.min(), y_test.max()], [y_test.min(), y_test.max()], '--k') # 绘制对角线
- plt.xlabel('True Values') # X轴标签
- plt.ylabel('Predictions') # Y轴标签
- plt.title('True Values vs Predictions') # 图标题
- plt.show()
-
- # 特征重要性可视化
- feature_importances = model.get_feature_importance() # 获取特征重要性
- feature_names = X.columns # 获取特征名称
-
- plt.figure(figsize=(10, 6))
- sns.barplot(x=feature_importances, y=feature_names) # 绘制特征重要性条形图
- plt.title('Feature Importances') # 图标题
- plt.show()
-
- # 输出
- '''
- mpg cylinders displacement horsepower weight acceleration
- 0 18.0 8 307.0 130.0 3504.0 12.0
- 1 15.0 8 350.0 165.0 3693.0 11.5
- 2 18.0 8 318.0 150.0 3436.0 11.0
- 3 16.0 8 304.0 150.0 3433.0 12.0
- 4 17.0 8 302.0 140.0 3449.0 10.5
- model_year origin
- 0 70 1
- 1 70 1
- 2 70 1
- 3 70 1
- 4 70 1
- 0: learn: 7.3598113 test: 6.6405869 best: 6.6405869 (0) total: 1.7ms remaining: 1.69s
- 100: learn: 1.5990203 test: 2.3207830 best: 2.3207666 (94) total: 132ms remaining: 1.17s
- 200: learn: 1.0613606 test: 2.2319632 best: 2.2284239 (183) total: 272ms remaining: 1.08s
- Stopped by overfitting detector (50 iterations wait)
- bestTest = 2.21453232
- bestIteration = 238
- Shrink model to first 239 iterations.
- Mean Squared Error (MSE): 4.9042
- Mean Absolute Error (MAE): 1.6381
- <Figure size 1000x600 with 1 Axes>
- <Figure size 1000x600 with 1 Axes>
- '''
Mean Squared Error (MSE): Mean square error, which represents the average square difference between the predicted value and the actual value. The smaller the value, the better the model performance. Here the value of MSE is 4.9042.
Mean Absolute Error (MAE): Mean absolute error, which represents the average absolute difference between the predicted value and the actual value. The smaller the value, the better the model performance. Here the value of MAE is 1.6381.
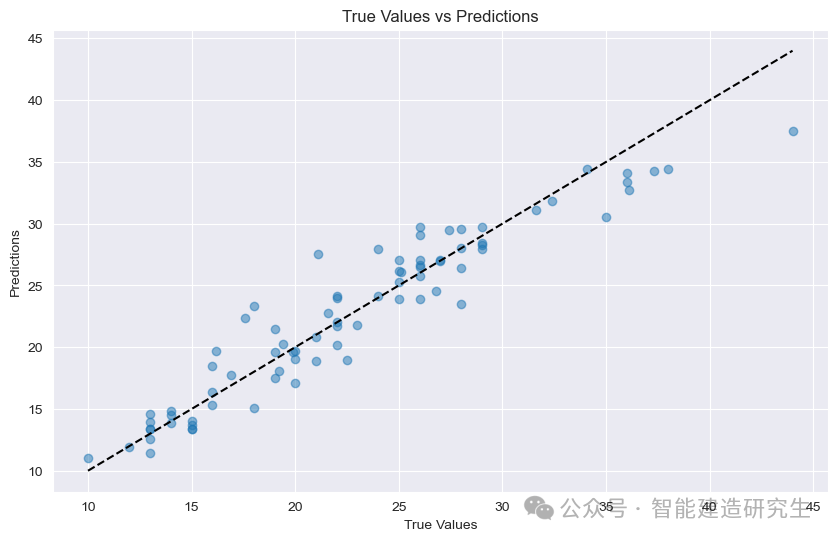
Scatter plot:Each point in the figure represents a test sample. The horizontal axis represents the true value of the sample (MPG), and the vertical axis represents the predicted value of the model (MPG).
diagonal: The black dotted line in the figure is a 45-degree diagonal line, which represents the prediction result under ideal circumstances, that is, the predicted value is equal to the true value.
Distribution of points:
Close to the diagonal: Indicates that the predicted value of the model is very close to the true value and the prediction is accurate.
Stay away from diagonals: Indicates that there is a large gap between the predicted value and the true value, and the prediction is inaccurate.
From the points in the figure, we can see that most of the points are concentrated near the diagonal line, which indicates that the model's prediction performance is good, but there are also some points far away from the diagonal line, indicating that there is a certain gap between the predicted values of these samples and the true values.
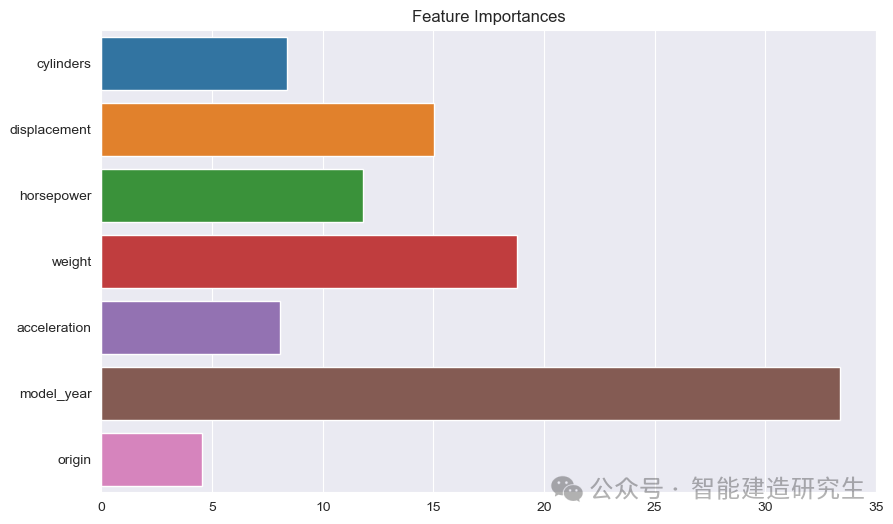
Bar Chart: Each bar represents the importance of a feature in the model. The longer the bar, the greater the contribution of the feature to the model prediction.
Feature Name: Lists the names of all features on the Y-axis.
Feature importance value: The relative importance value of each feature is shown on the X-axis.
From the figure we can see:
model_year: The most important of all the features, indicating that the year of manufacture of the car has a great influence on predicting fuel efficiency.
weight: The weight of a car is the second most important characteristic and also has a significant impact on fuel efficiency.
displacementandhorsepower: The engine's displacement and power also contribute greatly to fuel efficiency.
In this example, we use CatBoost on the Auto MPG dataset, where the main goal is to build a regression model to predict the fuel efficiency (i.e., miles per gallon, MPG) of a car.
The above content is summarized from the Internet. If it is helpful, please forward it. See you next time!

I have devoted myself to the research of technology for more than 30 years. I am proficient in various languages such as Java, Linux, JavaScript, PHP, CSS, etc. I have made many contributions in the field of open source. I have established a developer documentation site to share some problems in technology development for everyone to read.

